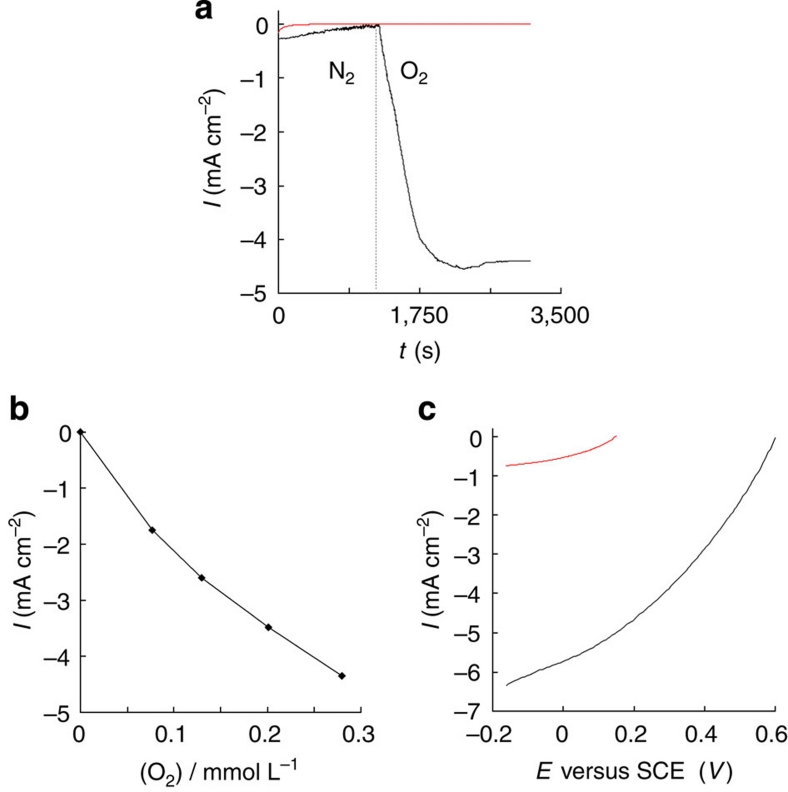
Figure 3. Biocathode performances.
(a) Chronoamperometric response for biocathode (red) without laccase, (black) with 20% laccase, in N2 saturated solution and after saturation with dioxygen at 0 V versus SCE. (b) Amperometric response at the biocathode (20% laccase) potentiostated at 0 V as a function of dioxygen concentration. (c) Polarization curves of the biocathode, (red) without laccase and (black) with 20% laccase, in air-saturated solution (2 mV s−1 scan rate). Experiments carried out in air-saturated phosphate buffer 0.1 mol l−1, pH 7.0.

