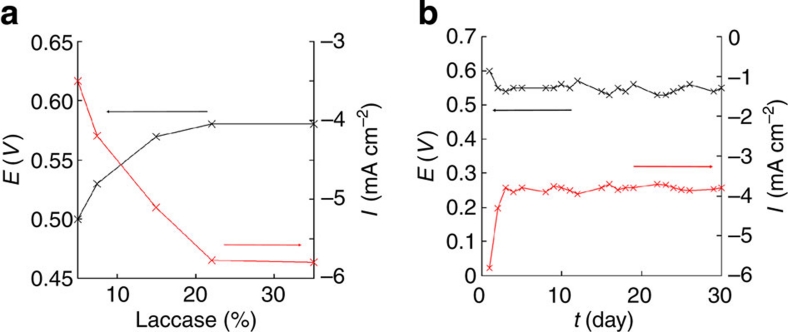
Figure 4. Influence of the laccase loading and operational time on the biocathode performance.
(a) Evolution of OCP (black) and current density (red) at 0 V, with different amounts of laccase (mass percentage in the electrode) in air-saturated solution. (b)Evolution of OCP (black) and current density (red) at 0 V, of biocathode (20% laccase) versus time. Experiments carried out in air-saturated phosphate buffer 0.1 mol l−1, pH 7.0.

