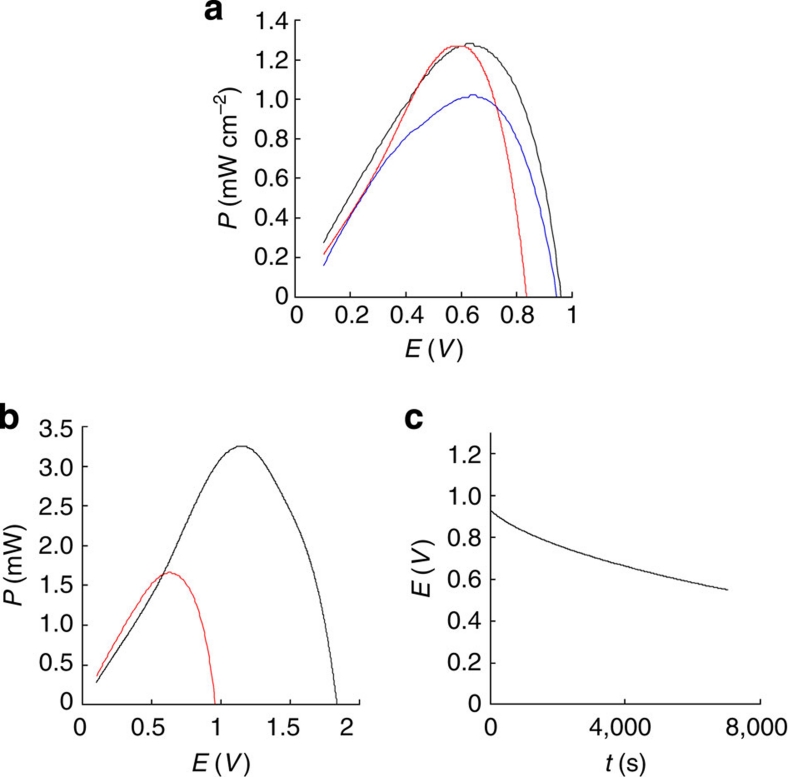
Figure 6. GBFC performances.
(a) Dependence of power density on operating voltage in 0.05 mol l−1 glucose solution before (black) and after one month (red). Blue curve: dependence of power density on operating voltage in 5 × 10⁻³ mol l−1 glucose. (b) Dependence of power on operating voltage in 0.05 mol l−1 glucose solution for one GBFC (red) and two GBFCs connected in series (black). (c) Dependence of voltage on time for continuous discharge under 200 μA cm−2 in 0.05 mol l−1 glucose solution. Experiments carried out in air-saturated phosphate buffer 0.1 mol l−1, pH 7.0 (bioanode: catalase/GOx ratio 1:1, biocathode: 20% laccase).

