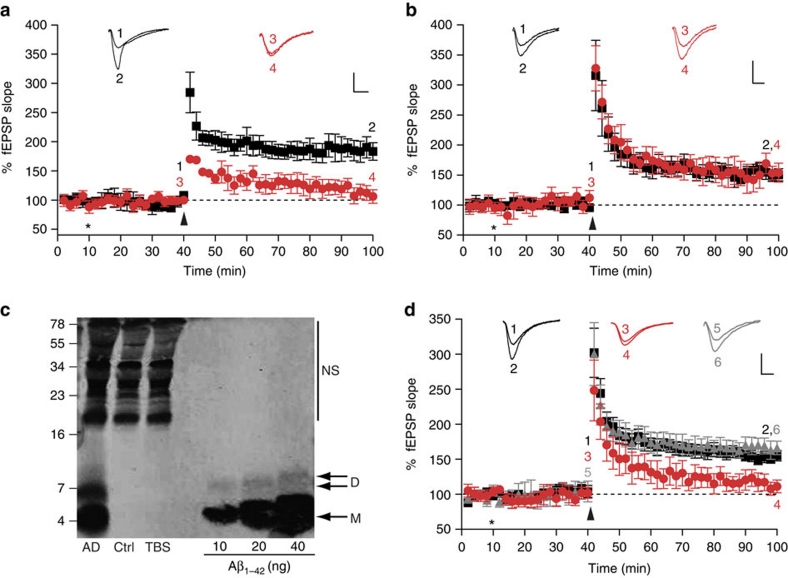
Figure 2. PrPC is required for the inhibition of LTP by bADDLs and Aβ-containing extracts of human brain.
fEPSPs were recorded from the CA1 region of the hippocampus in all cases. Insets show example fEPSP traces before and 1 h post theta-burst (TB) stimulation (stimulus artefact was removed for clarity). P values were calculated using one-way ANOVA and the Tukey–Kramer post hoc test. (a) Extracellular recordings from FVB/N mice show stable LTP measured up to 1 h post-TB (black squares, 184±15%, n=7). Pretreatment of the slices with bADDLS for 30 min before TB caused a significant inhibition of LTP (red circles, 109±10%, P<0.01, n=6). (b) LTP was reliably induced in slices from PrP null mice treated with vehicle control (black squares, 151±8%, n=6). Significantly, perfusion of slices from PrP null mice with the same bADDL preparation used in a, did not impair LTP (red circles, 149±11%, n=5, P>0.05). (c) Immunoprecipitation/western blot analysis of brain extracts revealed the presence of abundant Aβ monomer (M) and SDS-stable dimer (D) in a sample taken from an AD brain and the complete absence of Aβ in an extract from a non-demented control subject (Ctrl). Estimates of Aβ concentration indicate the presence of 14 and 3.2 ng ml−1 of monomer and SDS-stable dimer, respectively. Nonspecific (NS) immunoreactive bands were detected when Tris-buffered saline (TBS) alone was immunoprecipitated. Molecular weight markers are on the left. (d) Perfusion of slices from wild-type FVB mice with AD brain for 30 min before TB significantly impaired LTP (red circles, 116±9%, n=6) compared with slices perfused with control brain extract (black squares, 153±8%, n=6, P<0.05). In contrast, treatment of slices from PrP−/− mice with AD brain extracts failed to alter LTP (grey triangles, 164±10%, n=6, P>0.05). *Refers to when perfusion of bADDLs/AD brain extract was started and arrow denotes application of TB. The numbers on the example EPSPs (insets) represent the time points of the average fEPSP slope values indicated with the same numbers. All values are mean±s.e.m. Scale bar on insets denotes 1 mv, 5 ms.

