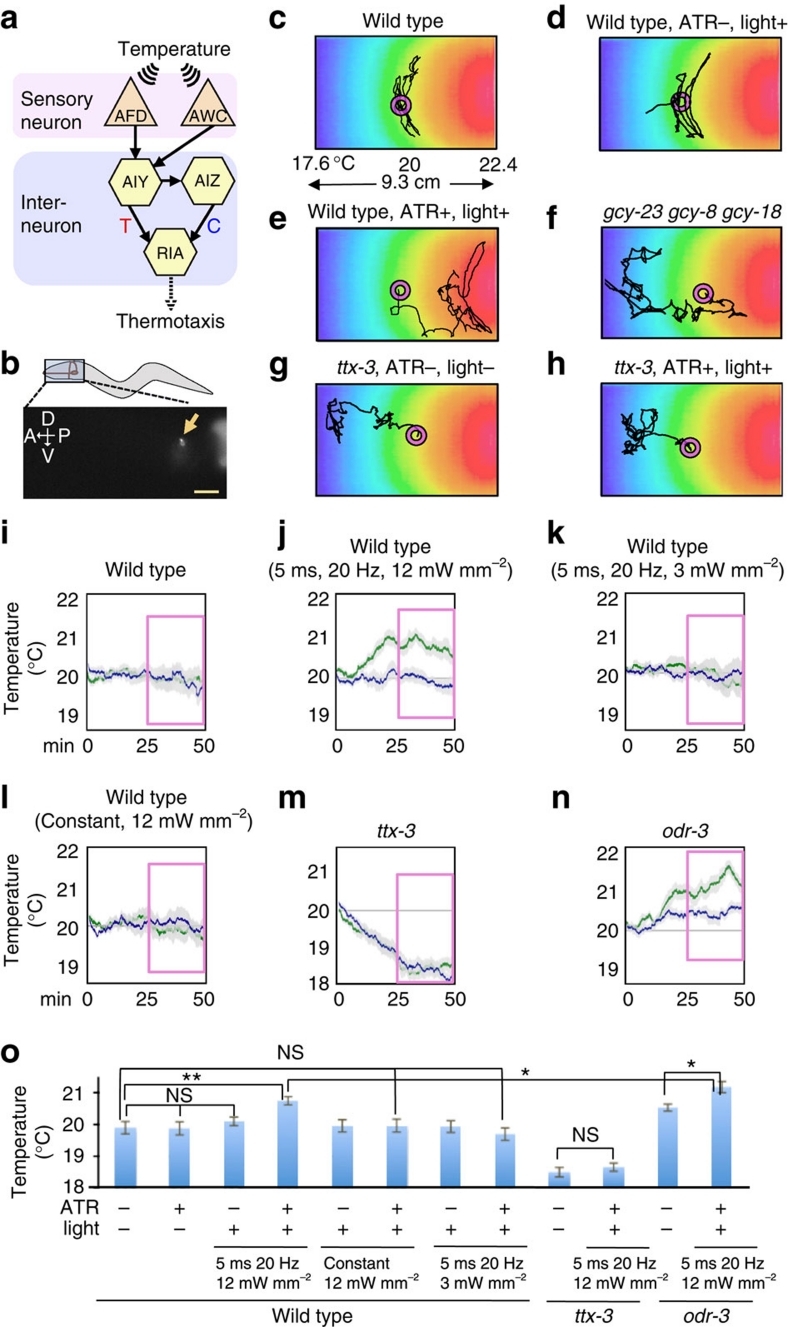
Figure 1. Thermotactic phenotype of halorhodopsin-activated animals.
(a) Neural circuit model for thermotaxis. Arrow indicates synaptic connection. Temperature is sensed by AFD and AWC sensory neuron. The activated AIY interneuron accelerates the movement to a temperature higher than the cultivation temperature (thermophilic drive; T), the activated AIZ accelerates the movement to a temperature lower than the cultivation temperature (cryophilic drive; C), and RIA interneuron integrates thermal signalling of 'T' and 'C'. (b) Expression of halorhodopsin fused with fluorescence protein. Arrow indicates AFD cell body. Scale bar: 25 μm. (c–h) Representative track of an animal on a temperature gradient. Adult animals, cultivated, at 20 °C were individually placed on a 9.3 cm thermal gradient between 17.6 and 22.4 °C, and were allowed to move freely for 50 min. Most wild-type animals leave striking isothermal tracks on the assay plate (c, d), whereas activation of halorhodopsin in AFD induces a thermophilic phenotype (e) that is the opposite phenotype in animals lacking guanylyl cyclases, which are essential for AFD temperature sensing (f). The temperature of the thermal gradient was measured by thermography. (i–n), Thermotaxis of 20 °C-cultivated animals. Blue indicates ATR-, light-. Green indicates ATR+, light−. Error bar indicates standard error of mean (s.e.m.). Each graph represents the average. n=15∼19 for each genotype. Halorhodopsin is expressed specifically in AFD of the animals. 25 min from 25 to 50 min (highlighted in pink) was used for comparative statistical analysis as shown in o. (o) Average temperature of animals' positions on thermal gradient during 25 min from 25 to 50 min (highlighted in pink as shown in i–n). Error bar indicates standard error of mean (s.e.m.). Single and double asterisk indicate P<0.05 and 0.01 in Dunnett test, respectively (Methods). NS, not significant (P>0.05).

