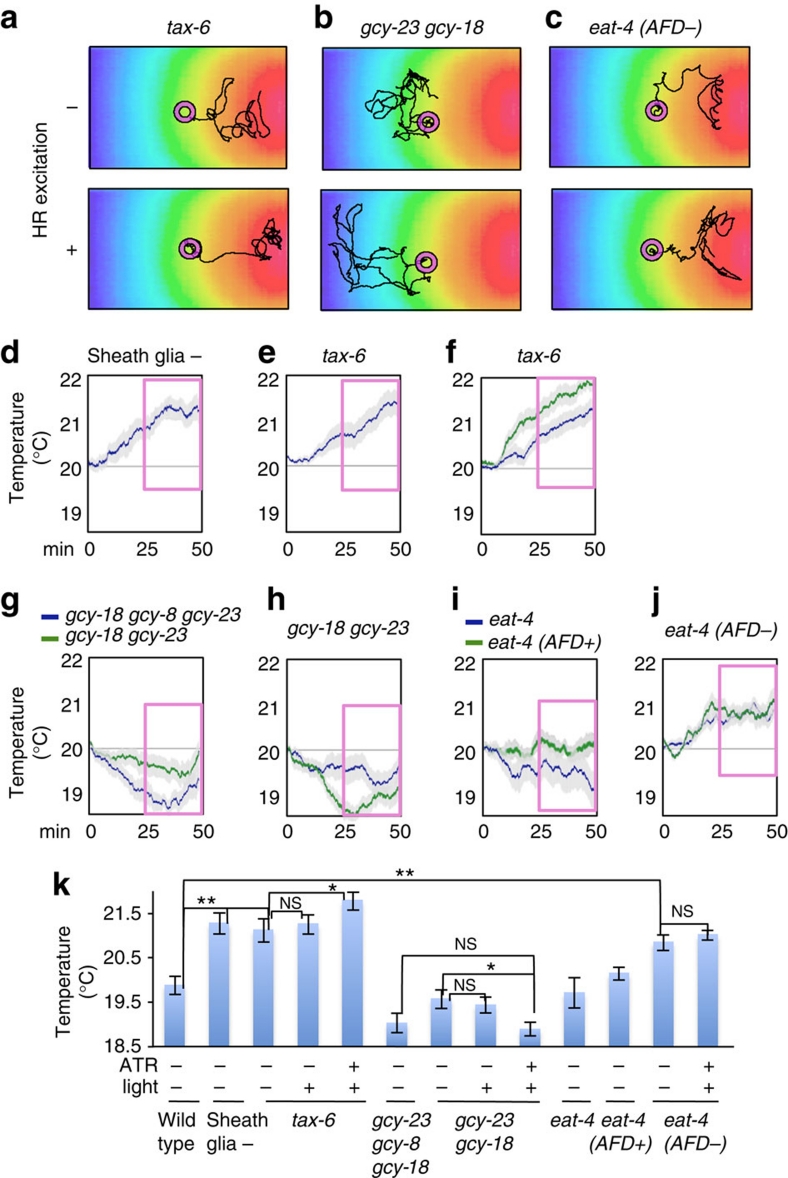
Figure 3. Thermotaxis of halorhodopsin-activated mutant animals.
(a–c) Representative tracks of 20 °C-cultivated animals expressing halorhodopsin in AFD. Adult animals were individually placed on a 9.3 cm thermal gradient between 17.6 and 22.4 °C, and were allowed to move freely for 50 min. (d, e) Thermotaxis of 20 °C-cultivated thermophilic mutant animals. 25 min from 25 to 50 min (highlighted in pink) was used for comparative statistical analysis as shown in k. Each graph represents the average. Error bar indicates s.e.m. n=12 (d) and 19 (e). (f) Thermotaxis of 20 °C-cultivated tax-6 mutant animals. Blue indicates ATR−, light+. Green indicates ATR+, light+. 5 ms 20 Hz pulsed-light (12 mW mm−2) was illuminated for activating halorhodopsin. Error bar indicates s.e.m. n=14 for each graph. (g) Thermotaxis of 20 °C-cultivated gcy-18 gcy-8 gcy-23 and gcy-18 gcy-23 animals. Blue indicates ATR-, light+. Green indicates ATR+, light+. n=15 for blue and 19 for green. (h) Thermotaxis of 20 °C-cultivated gcy-18 gcy-23 mutant animals. Blue indicates ATR-, light-. Green indicates ATR+, light+. 5 ms 20 Hz pulsed-light (12 mW mm−2) was illuminated for activating halorhodopsin. Error bar indicates s.e.m. n=16 for blue and 14 for green. (i) Summary for thermotaxis of 20 °C-cultivated eat-4 mutant animals. Each graph represents the average. The eat-4 mutant shows athermotactic abnormality (blue), which was restored by expressing EAT-4 in AFD, AWC and RIA in the thermotaxis neural circuit (green), as reported recently34. Error bar indicates s.e.m. n=14 for each genotype. (j) Thermotaxis of 20 °C-cultivated animals. Blue indicates ATR−, light−. Green indicates ATR+, light+. Expression of EAT-4 in AWC and RIA of eat-4 mutant induced thermophilic abnormality (blue), where malfunctions of EAT-4 in AWC and RIA are restored but EAT-4 in AFD remains to be impaired. 5 ms 20 Hz pulsed-light (12 mW mm−2) was illuminated for activating halorhodopsin. Error bar indicates s.e.m. n=14 for blue and 13 for green. (k) Average temperature in each time point of moving animals on thermal gradient during 25 min from 25 to 50 min (highlighted in pink as shown in d–j). Error bar indicates s.e.m. Single and double asterisk indicate P<0.05 and 0.01 in Dunnett test, respectively. NS, not significant.

