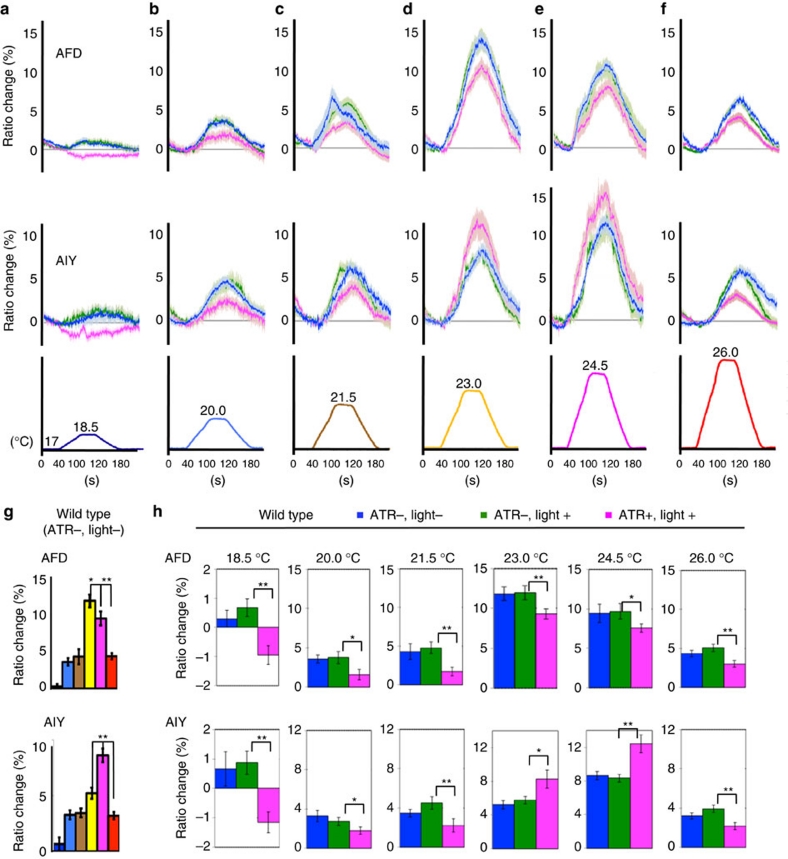
Figure 5. Relationship between increasing AFD responses and AIY responses.
(a–f) Calcium imaging of AFD and AIY neurons of wild-type animals in a systematic dose-response experiment using different degrees of temperature increment and decrement. Blue, green and magenta indicate [ATR−, light−], [ATR−, light+] and [ATR+, light+], respectively. Temperature change along time is shown at the bottom of the graph. halorhodopsin was expressed in AFD specifically. 'Light +' indicates 5 ms 20 Hz pulsed-light (12 mW mm−2) for activation of halorhodopsin. Error bar indicates s.e.m. Each graph represents the average. n=13∼22. (g) Average ratio change of wild-type animals (ATR−, light−) (a–f) during 20 s from 100 to 120 s after starting temperature change. The colour key for bar graph is the same as that for the corresponding temperature curve shown at the bottom of the graph a–f. (h) The average ratio change of the respective animals (a–f) is shown during the 20-s period from 100 to 120 s after starting the temperature change. The colour key for the bar graph is the same as that for the corresponding response curve shown in a–f. The error bars indicate s.e.m. n=13–22. Single and double asterisks indicate P<0.05 and P<0.01, respectively, by the Dunnett test. 'Light +' indicates 5 ms 20 Hz pulsed-light (12 mW mm−2) for activation of halorhodopsin.

