Figure 5.

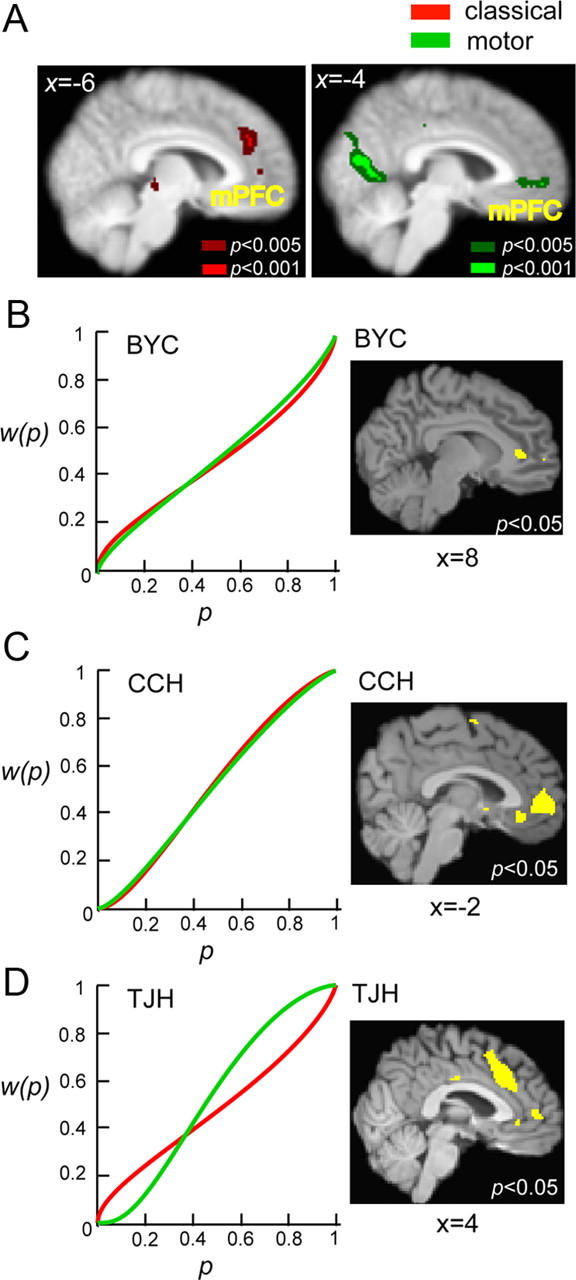
Neural correlates of probability weight. A, Statistical parametric maps obtained from random-effect analysis at the group level. Green represented clusters of voxels positively and significantly correlated with probability weight (dark green, p < 0.005; bright green, p < 0.001 uncorrected). Red represented clusters of voxels (cluster size > 15 voxels) significantly and positively correlated with probability weight in the classical task at the same thresholds. Distinct regions in the mPFC [classical: peak voxel, (−8, 36, 30), z = 3.19; motor: peak voxel, (−4, 54, −2), z = 3.12] significantly coded for probability weight in both tasks. Activity in the occipital cortex exhibited strong correlation with probability weight in the motor task [peak voxel, (−18, −54, −10), z = 4.22]. B–D, Results from three individual subjects. For each subject, we plotted the probability weighting function, w(p), separately estimated for the classical task (red) and the motor task (green) on the left and areas significantly correlated with the w(p) in both tasks (conjunction analysis). The statistical maps were overlaid on the individual subject's high-resolution T1 image. Each subject exhibited unique shapes of w(p), and activity in mPFC represented these distinct shapes that could be seen at the individual level in these subjects. Voxel coordinates were in MNI space.
