
Figure 7.
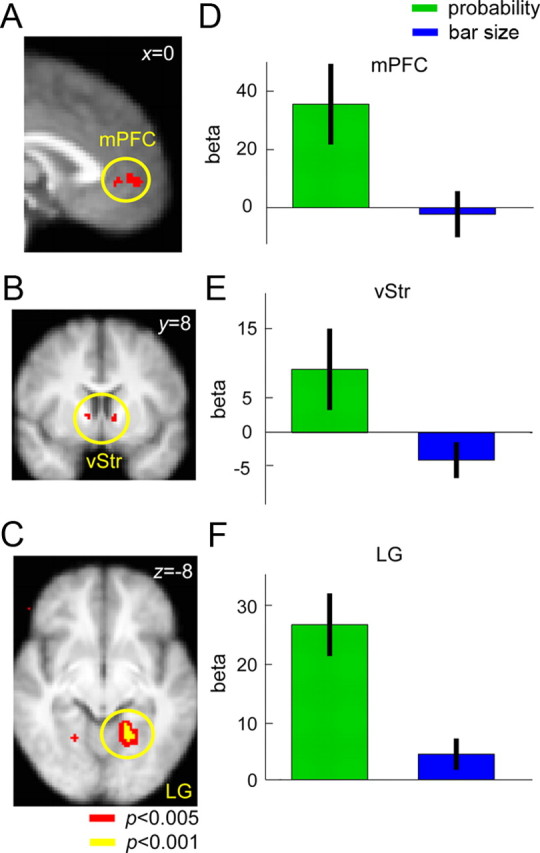
Neural representation of probability weight compared with bar size. We compared the neural representation of probability weight in the motor lottery task with the neural representation of bar size in the size judgment task. A–C, Thresholded statistical map for the contrast (probability weight in motor task − bar size in the size judgment task) was shown on the left column in mPFC [peak voxel, (−4, 54, −2], z = 3.05], vStr [peak voxel, (−10, 8, 0), z = 2.77] and the LG in the occipital cortex [peak voxel, (−18, −52, −8), z = 3.30]. Voxel coordinates were in MNI space. D–F, Mean parameter estimates (beta) of the probability–weight contrast obtained from the motor lottery task and the size contrast from the size judgement task were extracted from the mPFC, vStr, and LG regions of interest shown in A–C and plotted. Green represents the probability–weight contrast, while blue represents the size contrast. Error bars, ±1 SEM.