
Fig. 1.
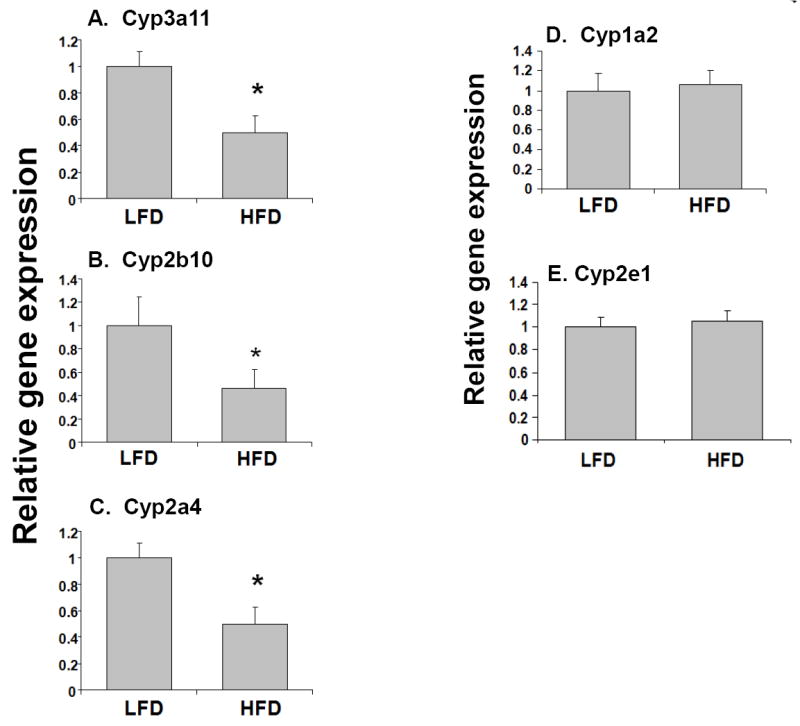
Effects of high fat diet on the RNA levels of phase I DMEs genes in mouse. LFD and HFD mice were fed diets with 10% and 60% kcal from fat respectively, for 14 weeks. RNA was isolated from the livers (n=10-12 per group) and Cyp3a11 (A), Cyp2b10 (B), Cyp2a4(C), Cyp1a2 (D), Cyp2e1 and (E) RNA levels were quantified by TaqMan® real-time PCR as described in Materials and methods. Data are presented as mean ± SD and normalized to cyclophilin mRNA levels. The asterisks indicate p < 0.05 between LFD and HFD groups.