
Fig. 2.
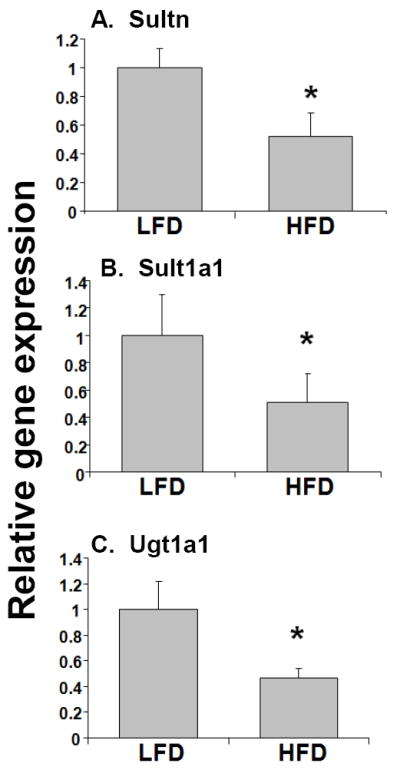
Effects of high fat diet on the RNA levels of phase II DMEs genes. RNA was isolated from the livers (n=10-12 per group) and Sultn (A), Sult1a1 (B), and Ugt1a1 (C) RNA levels were quantified by TaqMan® real-time PCR as described in Materials and methods. Data are presented as mean ± SD and normalized to cyclophilin mRNA levels. The asterisks indicate p < 0.05 between LFD and HFD groups.