
Fig. 5.
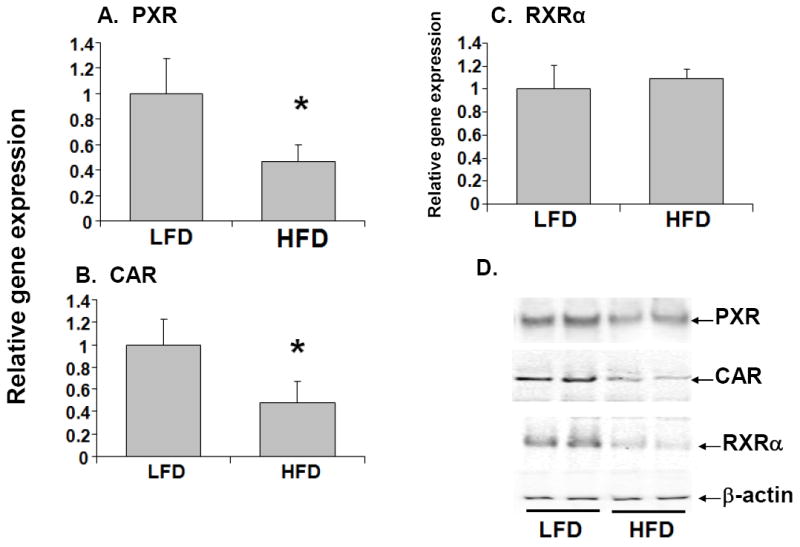
Effects of high fat diet on the expression of nuclear receptors. RNA was isolated from mouse livers (n=10-12 per group) and PXR (A), CAR (B), and RXRα (C) RNA levels were quantified by TaqMan® real-time PCR as described in Materials and methods. Data are presented as mean ± SD and normalized to cyclophilin RNA levels. RXRα protein expression was also analyzed by immunoblotting of nuclear extracts prepared from livers of mice (D). The asterisks indicate p < 0.05 between LFD and HFD groups.