Fig. 5.
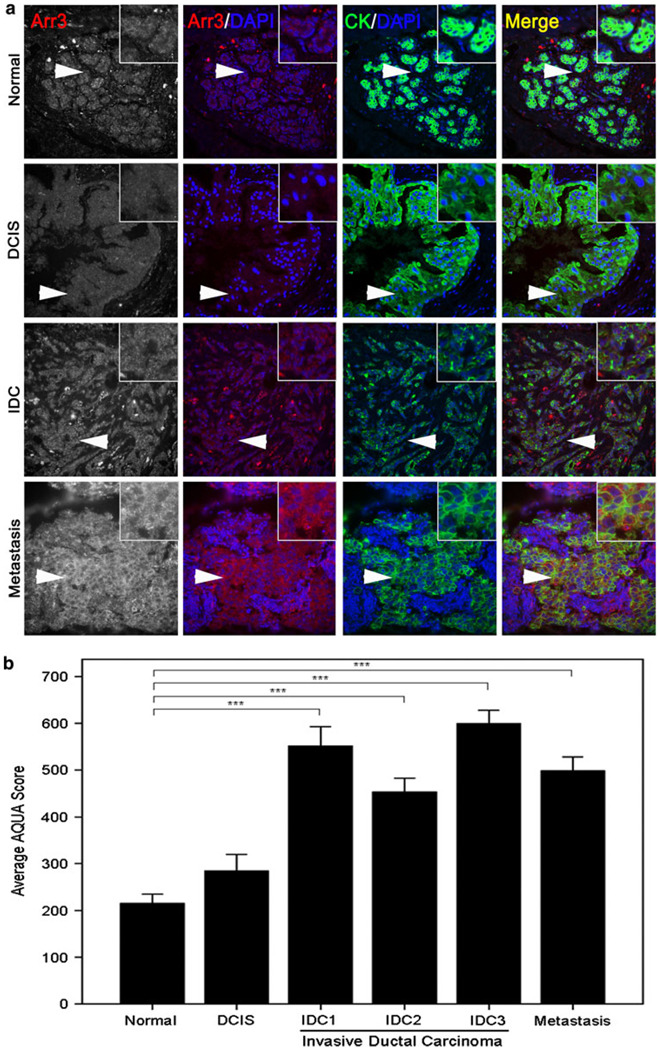
Arrestin3 expression increases with breast cancer progression. a A CEMA breast tumor progression array was stained for arrestin3. About 35 samples of normal tissue, 16 samples of DCIS, 75 samples of IDC, which included 16 cases of IDC grade 1 (IDC1), 30 cases of IDC grade 2 (IDC2), and 29 cases of IDC grade 3 (IDC3), and 19 samples of metastatic lymph nodes were evaluated for arrestin3 expression by AQUA analysis. Representative images of each stage are shown. Arrows denote inset regions. b. Quantitation of arrestin3 intensity in normal tissue, DCIS, IDC, and metastatic lymph nodes. An ANOVA test was utilized to determine statistical significance overall and Tukey’s post hoc test to determine differences between stages, and P < 0.001 (***) were considered statistically significant

