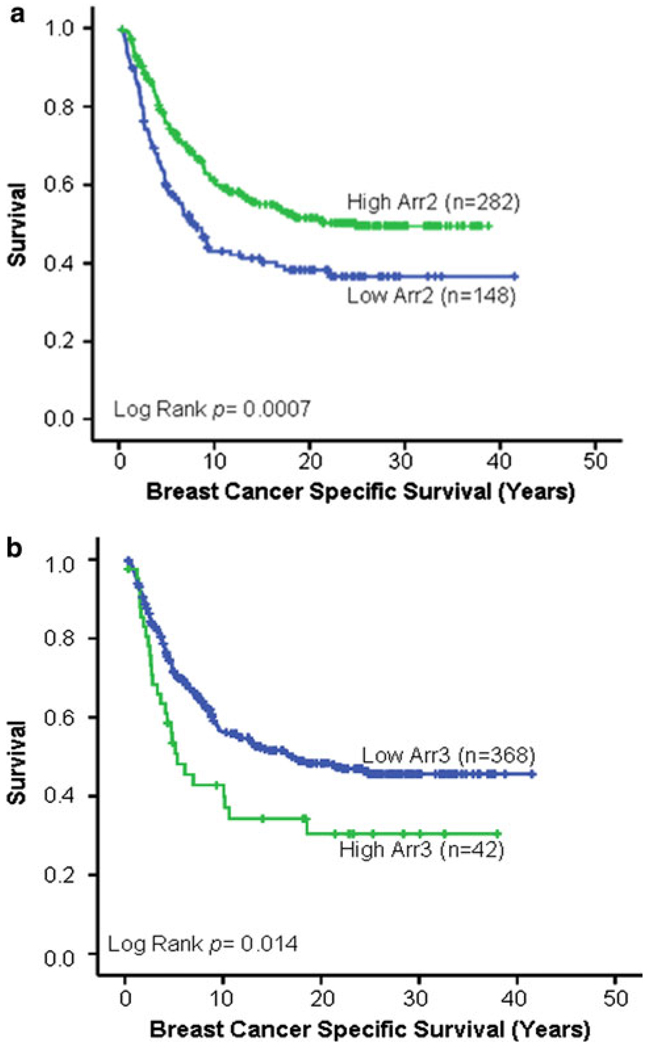
Fig. 6.
Arrestin expression is correlated with survival. a Arrestin2 expression information was obtained for 430 patients with survival data by AQUA. Using X-tile analysis, individuals were grouped into either low- (n = 148) or high-arrestin2 (n = 282) expressing groups. Kaplan–Meier survival curves were generated for survival analysis. It was observed that individuals within the low-arrestin2 group experienced poor survival (P = 0.0007). b Arrestin3 expression information was determined for 410 patients with survival data by AQUA. Individuals were grouped into either low-arrestin3 expression (n = 368) or high-arrestin3 expression (n = 42) groups using X-tile analysis. Kaplan–Meier survival curves were generated for survival analysis. It was observed that individuals within the high-arrestin3 groups experienced poor survival (P = 0.014)

