
Fig. 7.
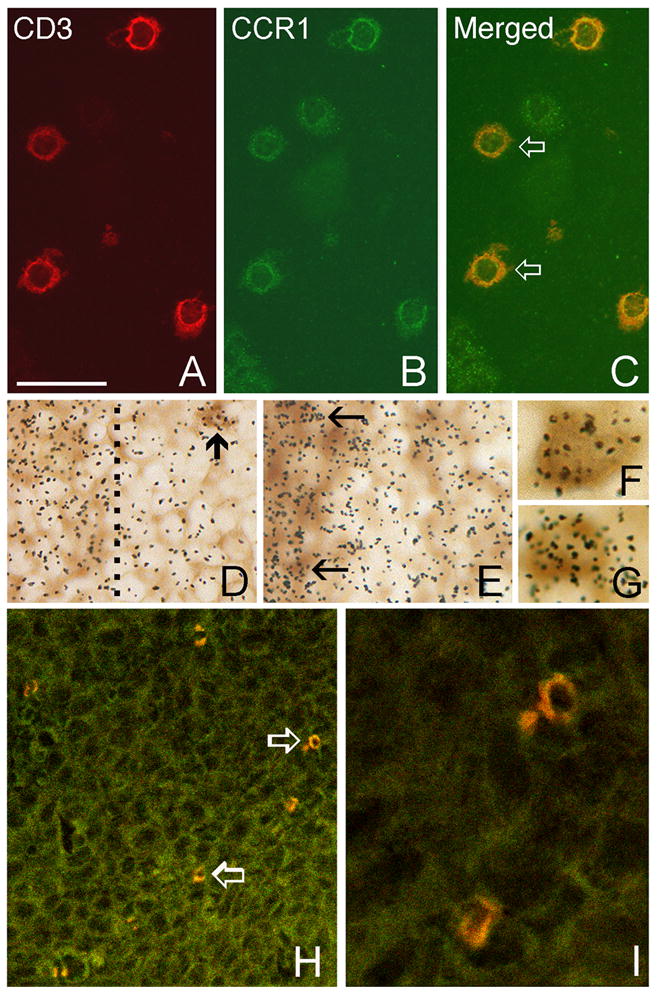
Expression of chemokines and chemokine receptors by T cells. A–C. Immunostaining of tumor sections at 3-weeks of growth showing co-localization of CD3-immunoreactivity (red in A) with CCR1-immunoreactivity (green in B) in tumor-infiltrating T cells. Double-labeled cells in the merged image are indicated by open arrows (C). D–I. Immunolabeling of T-cells with CD3 antibody (brown reaction product) combined with in situ hybridization (silver grains) using 35S-labeled cRNAs for detection of CCR3 (D–E) and CCL5 mRNAs (F–G). Grain density indicative of CCR3 expression is concentrated over T cells located within periarteriole lymphoid sheaths in the spleens of normal mice (D), and is increased in the spleens of tumor-bearing mice (E). T cells within the sheaths are located to the left and the dashed line in D indicates the sheath margin. The arrow in D indicates a cluster of labeled T cells outside the sheath. The arrows in E indicate labeled cells within the sheath. F–G. Double labeling of tumor-infiltrating T cells at 3-weeks post tumor implantation for CCL5 and CD3. H-I. Merged confocal microscope images of CD8 (red) and CCL5 (green) immunostained tumor section showing CD8+ T cells that express CCL5 (open arrows in H). These cells are shown in higher maginification in I. Bar in A = 35 μm in A–C and I, 17 μm in D–E, 7 μm in F–G and 93 μm in H.