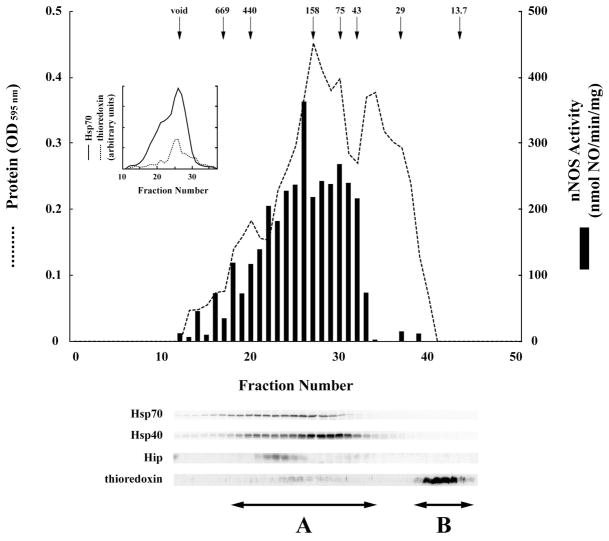
Figure 5.
Sephacryl S-300 chromatography of ATPFT. The ATPFT fraction was chromatographed on Sephacryl S-300, all fractions were assayed for total protein (dashed line) and fractions 12–40 were assayed for apo-nNOS activating activity (solid bars). The arrows indicate the peak elution of molecular mass markers expressed as kDa. Samples of each fraction from the void volume through the smallest marker peak were immunoblotted for Hsp70, Hsp40, Hip and thioredoxin. The inset shows the relative distribution of Hsp70 (solid line) and thioredoxin (dotted line) in fractions 12–38. Fractions defined by arrows A and B shown at bottom were combined and contracted to form the Seph A and Seph B samples assayed in Figure 6.

