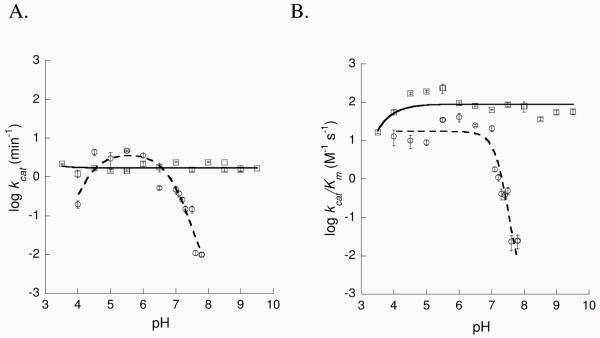
Figure 4.
Dependence of mutase kinetic parameters on pH. A) kcat – pH profiles for WT (□) and K42H (○). The WT data were fit to a simple linear regression (solid line) and for K42H to eqn 4 (dashed line). B) kcat/Km – pH profiles for WT (□) and K42H (○). The WT data were fit to eqn 1 (solid line) and for K42H to eqn 3 (dashed line).

