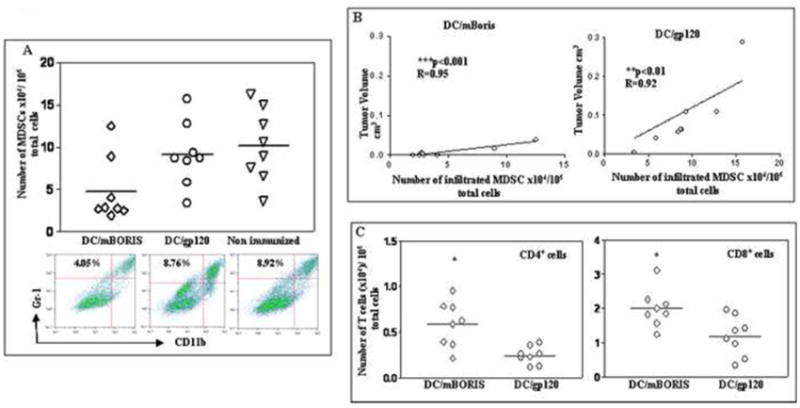
Figure 5.

Analysis of tumor-infiltrated suppressors and effectors cells in DC/mBORIS and control (DC/gp120) immunized mice and non-immunized control mice. (A) The numbers of tumor-infiltrated MDSC significantly (*P<0.05) decreased in mice immunized with DC/mBORIS compared with the numbers of these cells infiltrated in tumor sites of control mice. Representative plots for each group are presented. (B) The significant correlations between tumor-infiltrated MDSC and tumor volumes have been observed in both DC/mBORIS vaccinated (***P<0.001, R=0.95, n=8) and DC/gp120 control (**P<0.01, R= 0.92, n=8) animals. (C) Infiltrations of both CD4+ and CD8+ T cells significantly increased (*P<0.05) in mice vaccinated with DC/mBORIS vs of that in control animals.
Tumor-infiltrated cell populations were analyzed in tumors isolated from individual animals (n=8/group) and numbers of CD4+, CD8+ and MDSC, per 106 total cells are presented in A and C.
