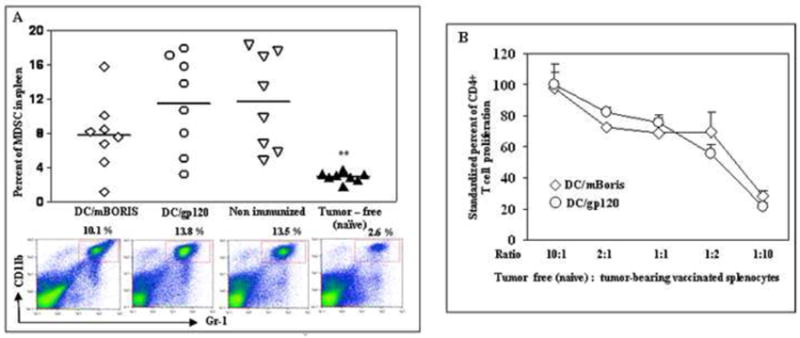
Figure 6.

Flow cytometric analysis of splenic MDSC from individual tumor-bearing and tumor-free mice. (A) depicts the levels of MDSC within all nucleated spleen cells. Representative plots for each group are presented. (B) Splenocytes from DC/mBORIS vaccinated and DC/gp120 injected control tumor-bearing mice inhibit polyclonal activation of CFSE-labeled naïve splenic CD4+ T lymphocytes from tumor-free mice (see details in Materials and Methods). Graphs of results from flow cytometric analysis (A) of individual animals and the results from each individual animal are depicted as a symbol and the mean of all animals in each group is noted by the horizontal bar. MDSCs were significantly elevated compared to naïve tumor-free animals (**P<0.01). Average data and SD in panel B are generated from two independent experiments with splenocytes isolated from 4 naïve and 4 tumor-bearing mice.
