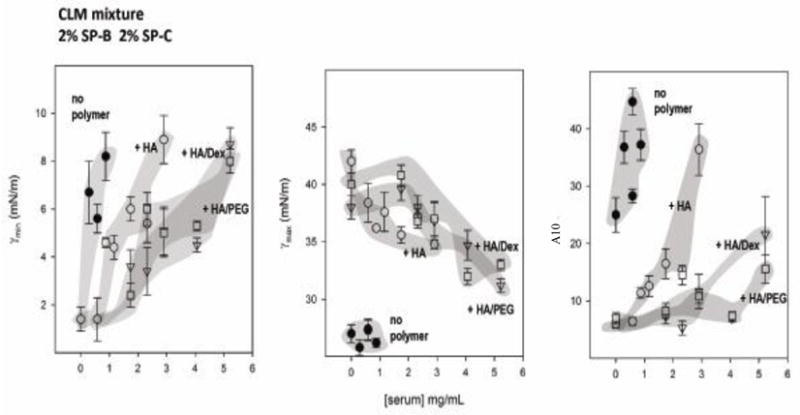
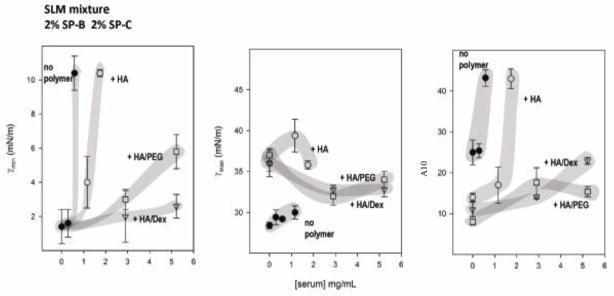
Fig 2.

Three measures of surface activity are compared for simple (SLM) or complex (CLM) lipid mixtures containing 2% SP-B and 2% SP-C as a function of the concentration of serum in the subphase. HA ± PEG or dextran were added to some mixtures. Minimum (γmin) (left panels) and maximum (γmax) (central panels) surface tension after 5 min of cycling, and the percent of surface area reduction required to reach surface tensions below 10 mN/m (A10 right panels) for various mixtures have been plotted versus the concentration of added serum protein for samples without polymers (closed circles), with HA (open circles), with HA and PEG (squares), or with HA and dextran (triangles). Data points are means ± SEM after averaging five replicates. Shaded areas were drawn to guide the eye.

