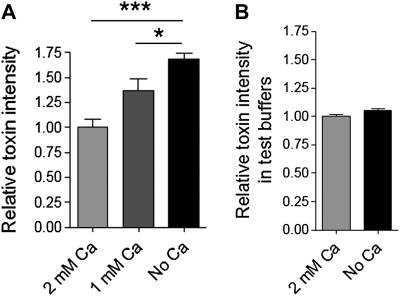
Figure 2.
A, Increase of GFP fluorescence intensity of the cells following exposure to 0.5 μg/mL GFP-PLY (10 minutes after challenge) as the concentration of the extracellular Ca falls. *P < .05, ***P < .001, one-way ANOVA with Bonferroni posttest (see Methods). B, Ca depletion in the imaging buffer does not substantially affect the GFP fluorescence of PLY-GFP in the cuvette. All values represent mean ± SEM, n = 5.

