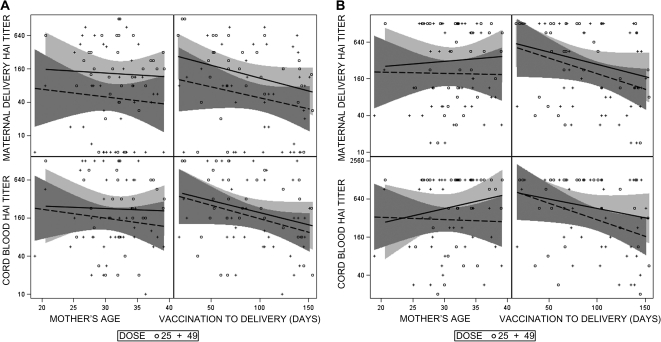
Figure 2.
Relationships between the variables of mother’s age in years at the first vaccination and interval in days between the second vaccination and delivery with the endpoints of cord blood and maternal delivery titers by hemagglutination inhibition (HAI) (A) and microneutralization (MN) (B) assays. The markers indicate the individual values for the 25-μg (circles) and 49-μg (crosses) dose groups, the lines are the estimated linear regression lines for each dose group (solid line, 25 μg; dashed line, 49 μg), and the shaded areas indicate the 95% confidence bands for each regression line.

