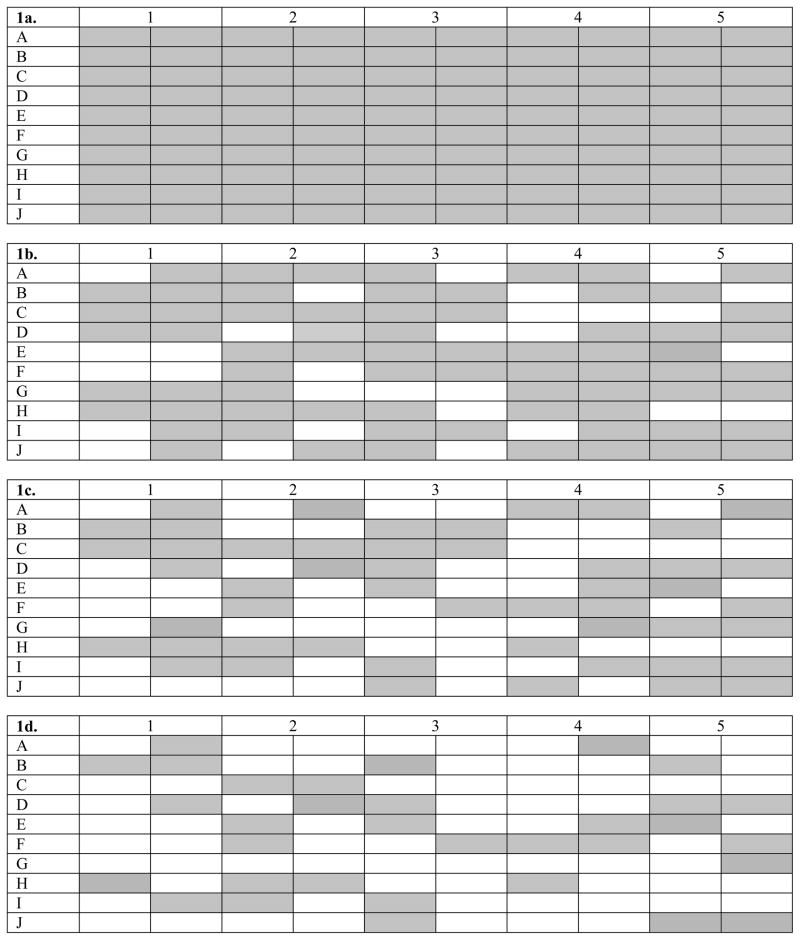
Figure 1. Coverage Matrices.
1a, the fully saturated initial coverage matrix depicting the 100 items (shaded cells) in the original item bank; 1b., coverage matrix after initial removal of 30 items; 1d., coverage matrix after removal of an additional 20 items; 1d., coverage matrix of the final 33-item MC-KOMIT selected through detailed item analysis.

