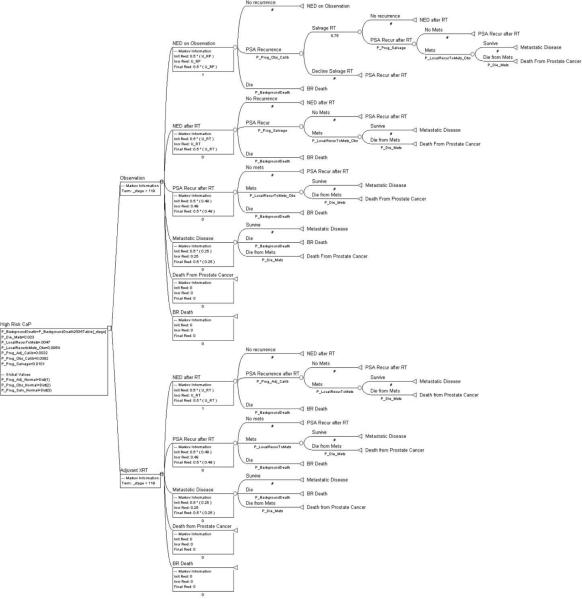
Figure 2.
Complete Markov decision analytic model as constructed using TreeAge Pro 2009 software. Pictured is the version we used for our cohort simulation. Background death rates with the strategies of observation and ART are both equal to the rates in the 2004 U.S. Life Table. 75% of men with a PSA recurrence on observation actually receive indicated SRT. SRT is delivered at a PSA threshold of ≤0.5 ng/ml. Note that the rate of progression from local recurrence to metastases is higher in the observation group than the ART group but the rate of progression from metastases to death is equal in the two groups. Note that to decline indicated SRT places someone in a health state equivalent to a post-RT PSA recurrence.

