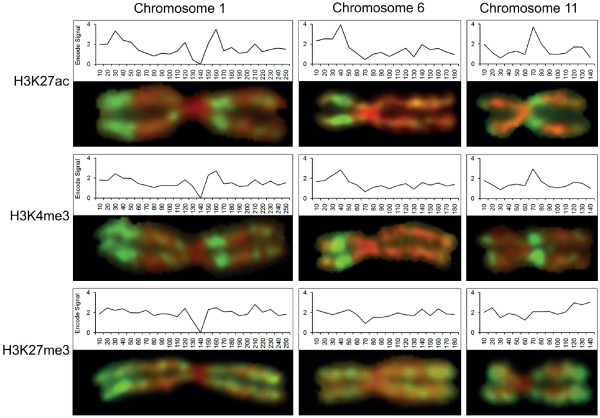
Figure 5.
Comparison of histone modifications across interphase and metaphase chromosomes. Representative metaphase chromosomes immunostained for H3K27ac, H3K4me3 and H3K27me3 are aligned with the distribution of the same modification across the equivalent interphase chromosome assembled from ENCODE ChIP-seq data [13]. Graphs were constructed by adding the number of reads within 10-Mb windows, as used to plot gene/CGI frequencies (Figure 3), transcript levels and fluorescein isothiocyanate (FITC) staining intensity (Figure 4).

