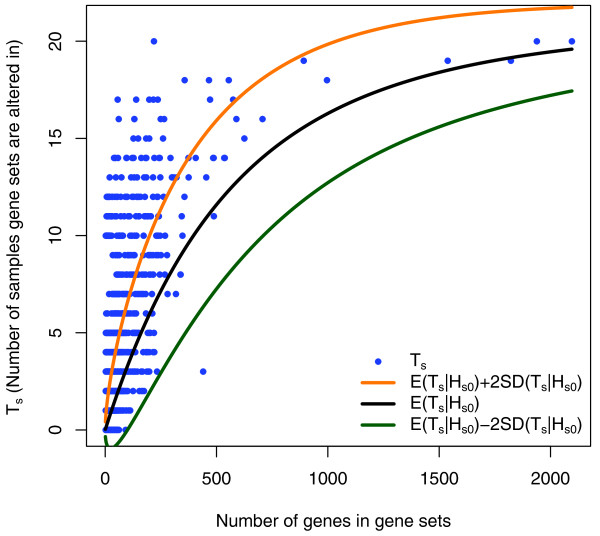
Figure 1.
Observed (blue) and expected number of altered samples (Ts) across the gene sets in the dataset from [4], as a function of the size of the gene set. The expected numbers are computed using the permutation null and denoted by E(Ts|Hs0). The values within two standard deviations of the E(Ts|Hs0) are also shown.

