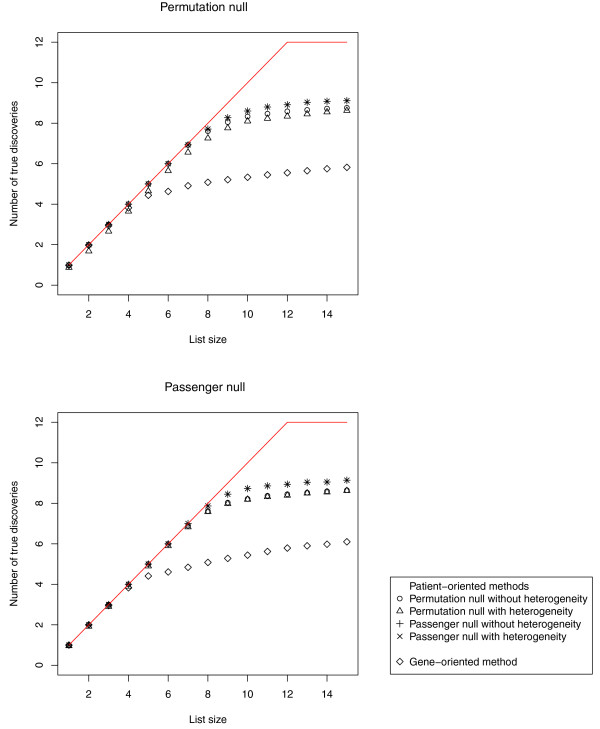
Figure 3.
Power analysis. Plot of the average number of truly positive (spiked-in) gene sets included in the top X gene sets, as X varies. The red line indicates the ideal scenario over 100 simulation runs. Simulations use the permutation null (top panel) or the passenger null (bottom panel) data-generating mechanisms. The four patient-oriented methods return more true positives than the gene-oriented method, except when one focuses on short lists, which include sets that are relatively easy to detect. (Note that the overlap of the two methods which use the passenger null looks like a star (*).)

