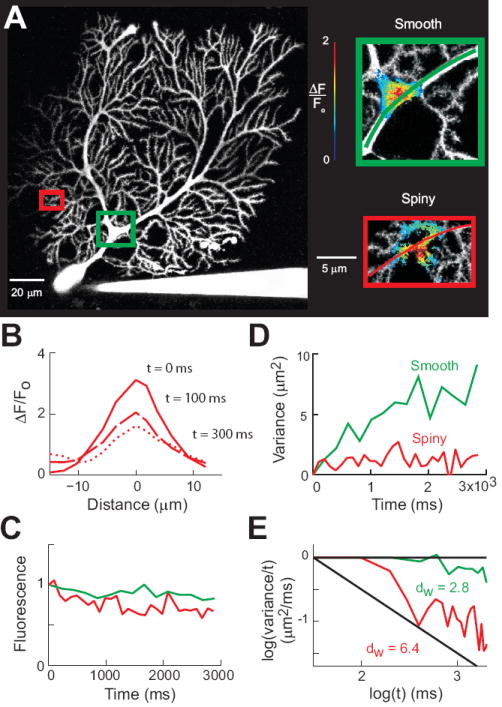
Figure 2.

Measuring intracellular diffusion in Purkinje cells. (A) Left - Maximum intensity projection image of a Purkinje cell filled with cascade blue. Colored rectangles indicate areas enlarged at right. Inset - Photoreleasing of caged RD in smooth and spiny dendrites. Pseudocolor images indicate relative changes in RD fluorescence after a 5 ms long flash of UV light. The images were taken 203 ms (top) and 99 ms (bottom) after RD photorelease. (B) Spatial distribution of fluorescence changes after photorelease in the spiny dendrite. (C) Time course of RD fluorescence after photorelease for the diffusion paths in insets of (A). Values are normalized to the intensity of RD fluorescence at the first time point after photorelease. (D) Time course of changes in spatial variance for the two experiments shown in (A), measured along the pathways indicated by the colored lines in insets of (A). (E) Logarithmic transforms of the data shown in (D). Diffusion in the smooth dendrites (green) is close to normal (horizontal line), while in the spiny dendrite (red) the data have a steep slope, indicating anomalous diffusion.
