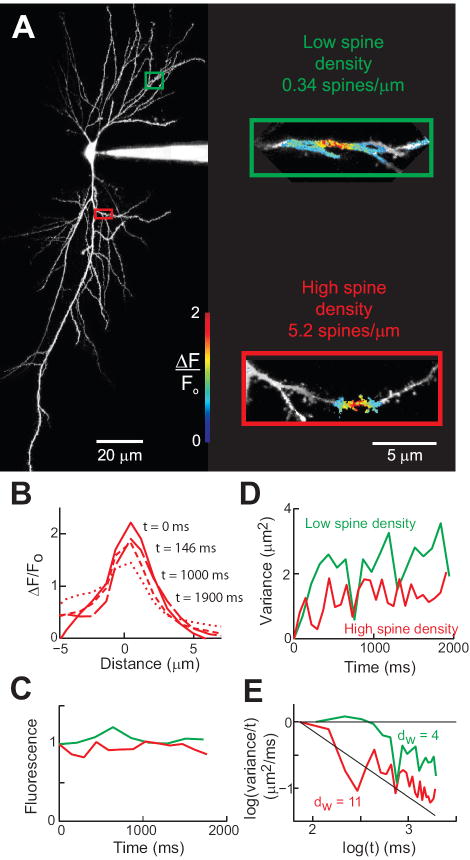
Figure 4.
Measuring intracellular diffusion in CA1 hippocampal pyramidal cells. (A) Maximum projection images of a pyramidal cell filled with cascade blue. Colored rectangles indicate areas enlarged at right. Inset - Photorelease of RD in dendrites with low (green) and high (red) densities of spines. Pseudocolor images indicate relative changes in RD fluorescence after a 5 ms long flash of UV light. The images were taken 108 ms (top) and 73 ms (bottom) after photorelease. (B) Spatial distribution of fluorescence along the high spine density dendrite in (A). (C) Normalized fluorescence after photorelease of RD (D) Time course of changes in spatial variance for the fluorescent profiles monitored along the dendrites shown in (A). (E) Logarithmic transform of the data shown in (B).

