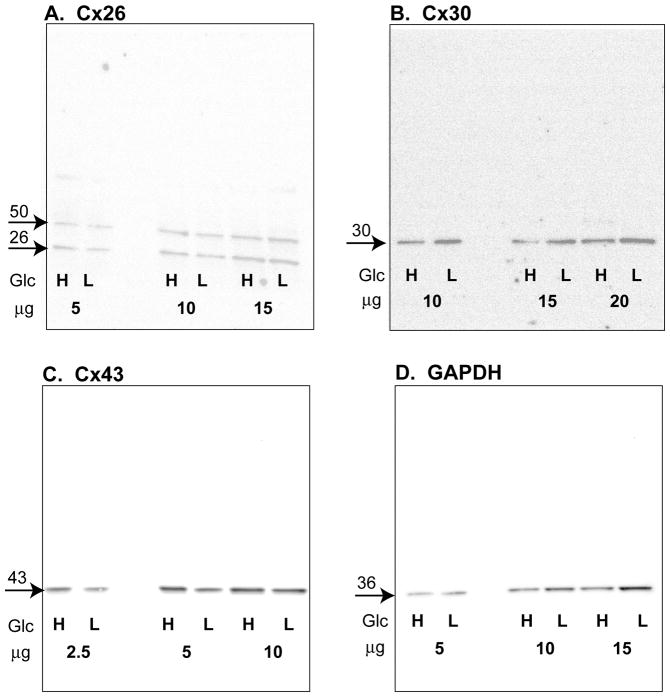
Fig. 1. Western blots from paired extracts of astrocytes grown in high or low glucose.
Extracts were prepared from each batch of cultured astrocytes in which cells were grown in low (L) (5.5 mmol/L) or high (H) (25 mmol/L) glucose (Glc). For each sample pair of each batch, the assay for each protein of interest was carried out by loading the same amount of extract protein for the high-low glucose pair into adjacent lanes of the gel. Three protein amounts over the range 2.5–20 μg were loaded on each gel, as indicated below each sample pair. The blots were first probed with an antibody against (A) connexin 26 (Cx26), (B) connexin 30 (Cx30), or (C) connexin 43 (Cx43), then stripped and probed for (D) glyceraldehyde-3-phosphate dehydrogenase (GAPDH). Each gel also contained molecular weight standards (not shown), and approximate molecular weights (kDa) of proteins of interest are indicated above the arrows in left margin of each panel; these values were determined in each gel by graphical analysis of semi-log plots of molecular weights of the protein standards and migration distances (relative to the dye front) of the standards and of proteins of interest. The boxed areas contain the entire blot and demonstrate that, except for Cx26, one predominant band was visualized for each connexin. Most, but not all, Cx26 gels showed two bands that, when present, had similar intensity levels; the band with the higher molecular weight (~50 kDa) may represent a dimer.

