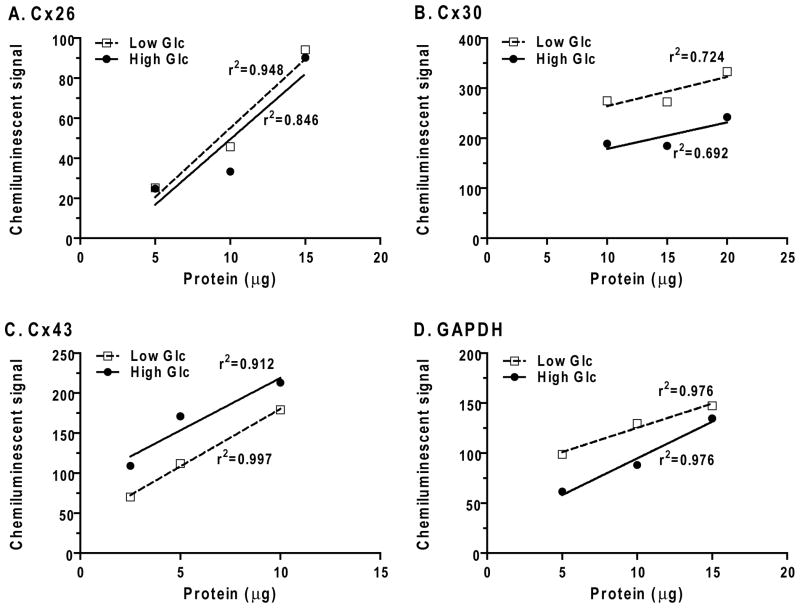
Fig. 2. Relationships of chemiluminescent signals to protein amount loaded on the gel.
Three amounts of protein from extracts of pairs of high and low glucose cultures were loaded onto adjacent lanes in each gel (see Fig. 1), separated by electrophoresis, transferred to membranes, and chemiluminescent signals captured (BioRad ChemiDoc system) and analyzed (MCID Elite™ software). Background-subtracted signals (arbitrary units) are plotted against the loaded protein amount for extracts from high and low glucose cultures.

