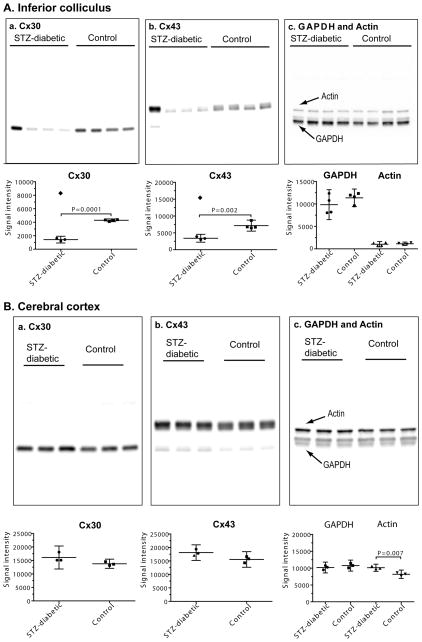
Fig. 4. Western blots showing regional selectivity of changes in levels of Cx30 and Cx43 in brain of streptozotocin (STZ)-diabetic rats at 5–6 months after onset of diabetes.
Samples of (A) inferior colliculus (n = 4/group) and (B) cerebral cortex (n = 3/group) from age-matched, vehicle-injected control and STZ-diabetic rats were assayed for Cx30 (a), Cx43 (b) and GAPDH and actin (c). The same amount of total protein from different tissue extract samples was loaded onto SDS-PAGE gels (upper panels in A and B) and Western blots were probed with antibodies against the indicated proteins. Separate gels and blots were used for assays of actin (43 kDa) and GAPDH (36 kDa), and each blot was probed with both antibodies.
Chemiluminescent signal intensities are in the lower panels of A and B. Values for each sample are shown; horizontal lines are mean ratios and vertical bars are ±95% confidence intervals. All samples were assayed on at least two replicate gels with all samples for each protein of interest on the same gel. (A) Note that one diabetic rat had a very high signal intensity in the Cx30 and Cx43 blots of samples of inferior colliculus (lane 1 from the left in the upper panels, denoted by filled diamonds in the lower panels) that was about twice that of the respective control mean (lower panels) and was even higher than the respective mean values for Cx30 and Cx43 in the other three rats; these two values were identified as a significant outliers (Grubbs test) from the other three values, and were not used to calculate mean values for diabetic Cx30 and Cx43 intensities. Statistically significant differences were identified by the t test; P values are indicated. In sharp contrast, the signal intensities for GAPDH and actin in the same outlier rat were similar to the other diabetic and control values (panel A–c, upper and lower panels), indicating that the connexin proteins, not other proteins in the same extract diverged from the rest of the samples in the group. Signal intensities for the three rats with low levels of immunoreactive Cx30 and Cx43 protein were also normalized relative to actin or GAPDH in the same sample (data not shown). When these normalized diabetic and control samples were compared (t test), the p values were as follows: Cx43/actin (p=0.034), Cx43/GAPDH (p=0.051), Cx30/actin (p=0.009), Cx30/GAPDH (p=0.005). Thus, Cx30 and Cx43 levels were significantly reduced, whether expressed relative to the amount of extract protein loaded onto the gel or to other proteins in the same samples. The rat with high levels of immunoreactive Cx30 and Cx43 protein also had higher-than-normal ratios when expressed relative to actin and GAPDH (see Table 1c). (B) Note that two immunoreactive bands were visible for GAPDH, and the bar graphs include both bands; a minor, lower molecular weight band for Cx43 was visible in the blots but was not assayed. When signal intensities for Cx30 and Cx43 were expressed relative to those for GAPDH or actin, there were no statistically significant differences between diabetic and control rats even though the level of immunoreactive actin was about 24% higher in the diabetic tissue (t test; P value indicated), normalized to loaded protein amount.

