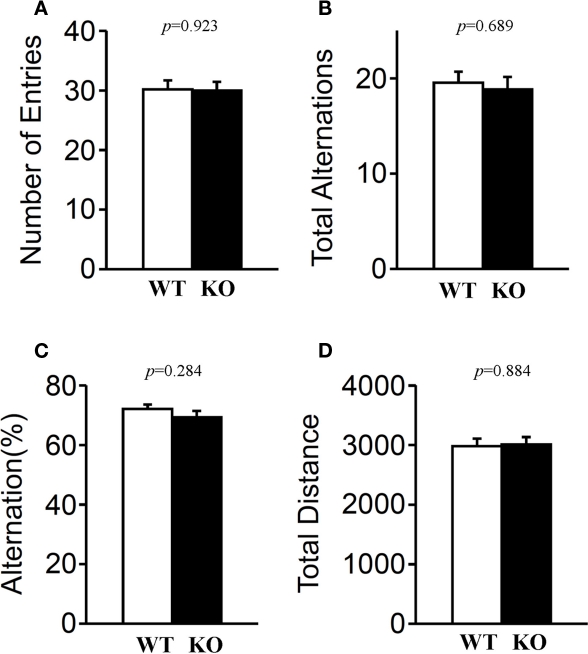
Figure 11.
Y-maze test. Mice (n = 20 each) were individually placed into a symmetrical Y-maze. Total number of arm entries (A), number (B) and percentage (C) of alternation between Y-maze arms, and total distance (D) were recorded. Data presented as mean ± SEM. p-Values were calculated by Student's t-test.

