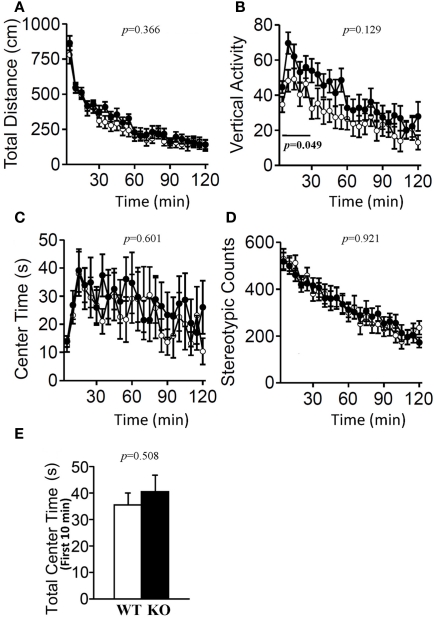
Figure 4.
Open field test. Total locomotion distance traveled (A), vertical activity (B), time spent in the center of the compartment (C), and stereotypic behavior (D) were recorded. Data are presented as mean ± SEM (n = 20 each). p-Values indicate significance of genotype effect in two-way repeated measures ANOVA. The vertical activity during the first 30 min (bar) was statistically significant (p = 0.049). (E) Data of the time spent in the central area during the first 10 min were also statistically analyzed using Student's t-test.

