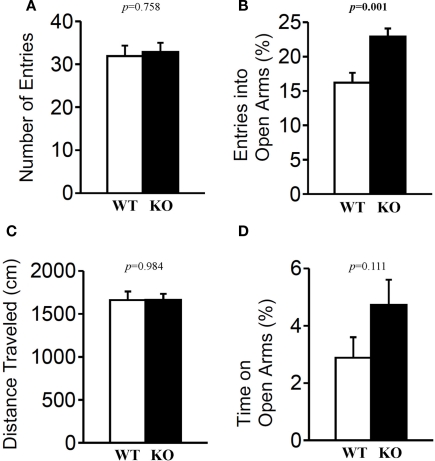
Figure 5.
Elevated plus maze test. Mice (n = 20 each) completed the elevated plus maze test. The number of arm entries (A), percentage of entry into open arms (B), distance traveled (C), and time spent in open arms (D) were recorded. Data are presented as mean ± SEM. p-Values were calculated by Student's t-test.

