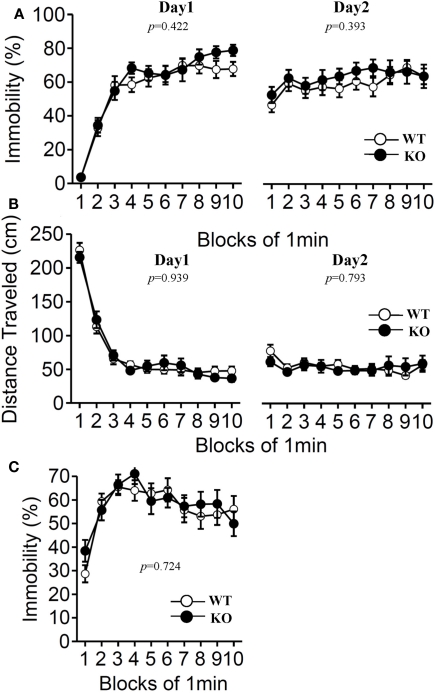
Figure 9.
Porsolt forced swim test and tail suspension test. The Porsolt forced swim test (A,B). Immobility time (A) and total distance traveled (B) were recorded in each block for days 1 and 2 (n = 20 each). Tail suspension test (C). Data are presented as mean ± SEM. p-Values indicate significance of genotype effect in two-way repeated measures ANOVA.

