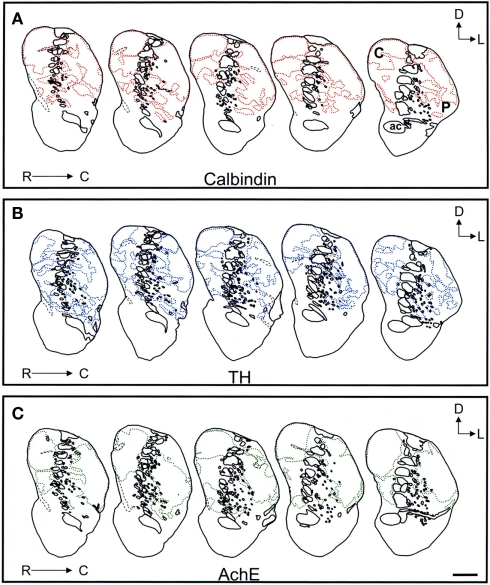
Figure 9.
Schematic drawings of the mid to caudal areas of the tree shrew dorsal striatum. These line drawings show the patch (striosomes) distribution for calbindin (A), TH (B), and AchE (C). Drawings were obtained from whole series of the same animal stained for the different markers. Each of the contiguous rostrocaudal sections of the same marker are separated 300 μm. Separation between parallel sections labeled for calbindin or TH is 50 μm, while between calbindin and AchE is 100 μm. Coordinates indicate the orientation of the sections in the figure (D, dorsal; L, lateral). ac, anterior commissure; C, caudate; P, putamen. Scale bars: 1 mm in (A–C).

