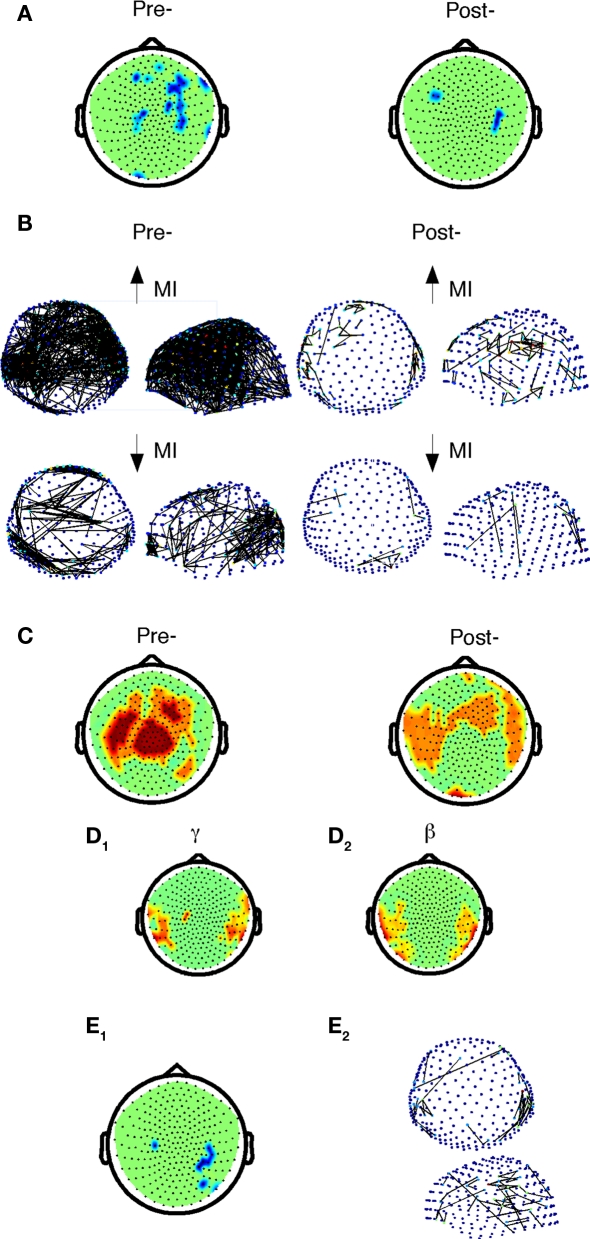
Figure 6.
Comparison of beta-band cost efficiency and power correlations with accuracy before and after practice in control subjects. (A) Negative correlations of accuracy with beta-band local cost efficiency (Holms–Bonferroni p < 1.8E-4) before and after practice. (B) Positive (top) and negative (below) correlations of accuracy and mutual information between sensors before (FDR p < 0.0017) and after practice (FDR p < 1.5E-4) in controls only. (C) Positive correlations of accuracy with beta-band power (dark red, Holms–Bonferroni p < 1.8E-4, light red, FDR p < 0.0036). (D) Nodes in which Δaccuracy correlated positively with Δpower among control subjects after practice in the gamma (D1), and beta (D2) frequency bands. (E1) Nodes in which Δaccuracy negatively correlated with Δlocal cost efficiency in control subjects (FDR, p < 0.0037). (E2) Top and side view of sensors that exhibited a positive correlation between Δaccuracy and ΔMI for controls in the beta band (FDR p < 5.9E-5).

