Figure 7.
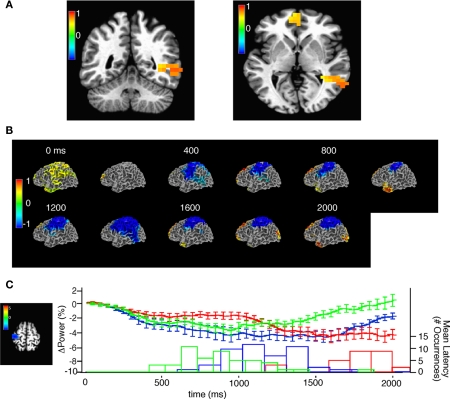
Source space analysis of beta power during task performance. (A) Two views of single window SAM showing beta-band power increases from −110 to 290 ms after the onset of the first stimulus, note that the stimulus is 130 ms in duration. Color bar indicates pseudo F-statistic, images thresholded at q (false discovery rate) < 0.05. (B) Sliding window SAM showing beta-band activity during task performance. In combined subjects. Note that the first, and second stimuli occur at 0 and 930 ms respectively and the average response time was at 1895 ms. Color bar indicates normalized power ratio (p < 0.01). (C) Beta-band desynchronization in motor cortex is related to response latency. (Left) voxels chosen for analysis of beta-band desynchronization with a p < 0.001, color bar indicates pseudo-F ratio. (Top) mean ± SEM beta-band power in the region of interest for trials with an 800 (red), 400 (blue), and 200 (green) ms inter-stimulus interval. (Bottom) histogram of the mean response latency for the corresponding trials.

