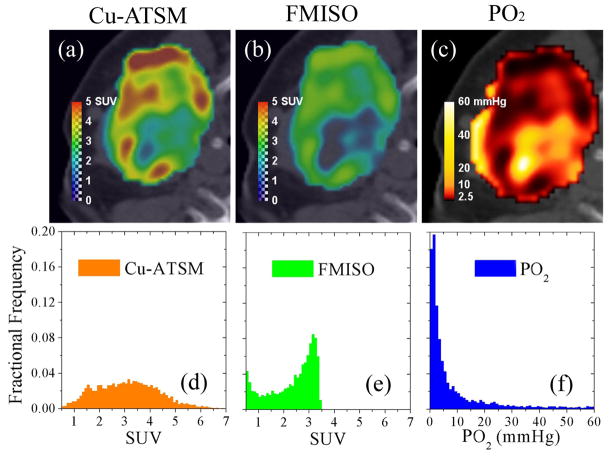
Figure 4. Comparison of measured Cu-ATSM uptake, modeled FMISO uptake, and modeled tissue oxygen tension in an example head-and-neck cancer patient.
High Cu-ATSM SUV regions (a) correspond to lower FMISO SUV (b) for a given PO2 level (c). The Gaussian Cu-ATSM uptake distribution (d) is equivalent to the skewed FMISO uptake distribution (e). The corresponding PO2 distribution (f) is highly skewed.

