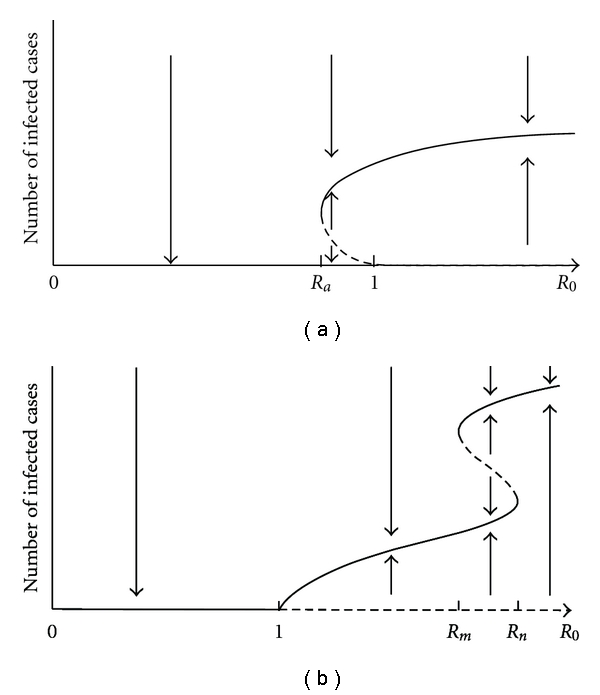
Figure 5.

The effects of backward bifurcations. Solid curves indicate stable equilibria, while dashed curves indicate unstable equilibria. (a) A backward bifurcation at R 0 = 1 may result in persistence of the disease when R 0 < 1. There is a point R a < 1 such that the endemic equilibrium exists for R a < R 0 < 1 and a third, unstable, equilibrium also exists. Hence, the disease-free equilibrium is only globally stable if 0 < R 0 < R a. (b) Backward bifurcations at other points may also affect the outcome. Although the disease persists for all R 0 > 1 and is eradicated when R 0 < 1 (due to the transcritical bifurcation at R 0 = 1), there is a region R m < R 0 < R n, where three equilibria coexist. In this region, the outcome depends on the initial conditions.
