
Figure 1.
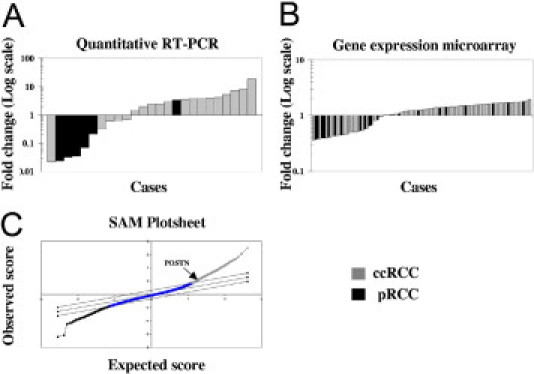
Periostin mRNA levels in RCC patients. A: Relative expression levels obtained from the quantitative RT-PCR analysis. B: Relative expression levels obtained from the Affymetrix microarray analysis. C: Significance Analysis of Microarrays (SAM) plotsheet of ccRCC versus papillary RCC (pRCC).