
Figure 4.
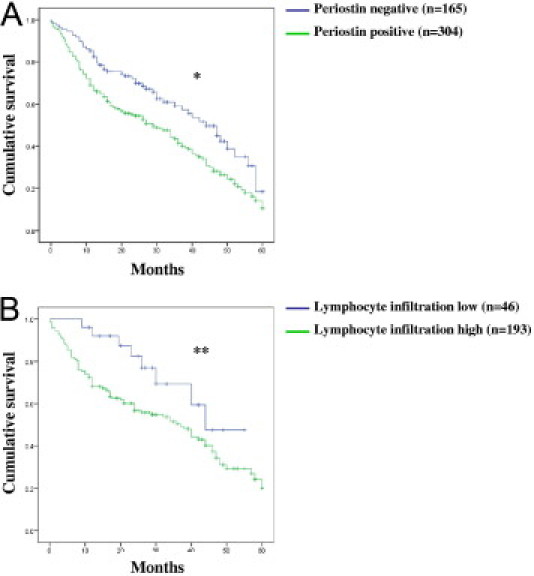
Cumulative univariate 5-year overall survival analysis. Kaplan-Meier curve (log-rank test) for periostin expression in the cytoplasm of tumor epithelial cells (*P = 0.009) (A) and for lymphocyte infiltration (**P = 0.002) (B). The median follow-up time was 39 months (range, 0 to 229 months). Periostin negative versus positive. Lymphocyte infiltration low versus high (for definition see text).