
Figure 4.
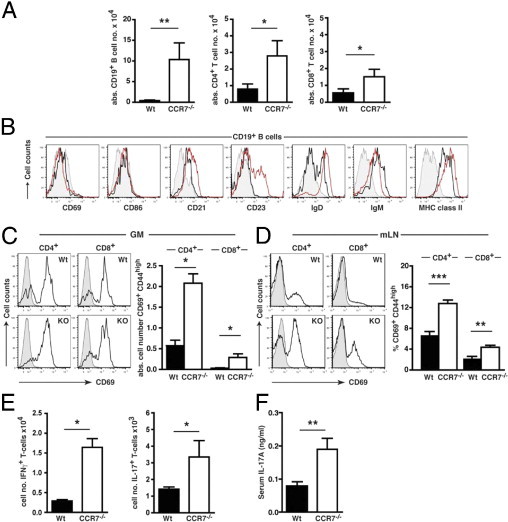
Immune cell subsets of CCR7−/− mice exhibit an activated and inflammatory phenotype within the GM and mLNs. A: Arithmetic means of absolute gastric CD19+ B cells and CD4+ and CD8+ T cells in the GM tissue of Wt (black bars; n = 12 to 13) and CCR7−/− (open bars; n = 5) mice. Data were calculated from flow cytometric analysis of CD3+CD4+ and CD3+CD8+ expression for T-cell subtypes and CD19+ expression for B cells of size-gated gastric lymphocytes. B: Flow cytometric analysis of activation and maturation markers on CD19+-gated B cells isolated from the GM of Wt (black curve; n = 6 to 9) or CCR7−/− mice (n = 7 to 10; red curve: isotype control). GM-derived (C) or mLN-derived (D) T-cell subsets (gated on CD4+ or CD8+) of 6- to 10-month-old CCR7−/− (GM, n = 12; mLN, n = 12 to 14) and Wt mice (GM, n = 9; mLN, n = 6 to 8) were stained for CD69 expression and analyzed by flow cytometry (shaded curve: isotype control). Total numbers of activated CD69+ CD44high T-cell subsets in GM (C; right panel) and percentages of activated CD69+ CD44high T-cell subsets in mLN (D; right panel) of Wt and CCR7−/− mice are shown. E: Flow cytometric analysis of IFN-γ or IL-17A production in GM-derived CD4+ T cells from Wt (n = 9) and CCR7−/− mice (n = 3) after in vitro culture with (+) or without (-) brefeldin, ionomycin, and PMA. Total numbers of gastric CD4+ IFN-γ+ or CD4+ IL-17A+ cells are shown. F: Serum samples from 4- to 6-week-old Wt (black bar; n = 9) and CCR7−/− mice (open bar; n = 9) were analyzed for the TH17 cytokine IL-17A by enzyme-linked immunosorbent. Bars in A–E represent mean ± SEM. *P < 0.05, **P < 0.01, and ***P < 0.001; Mann-Whitney U-test.