
Figure 4.
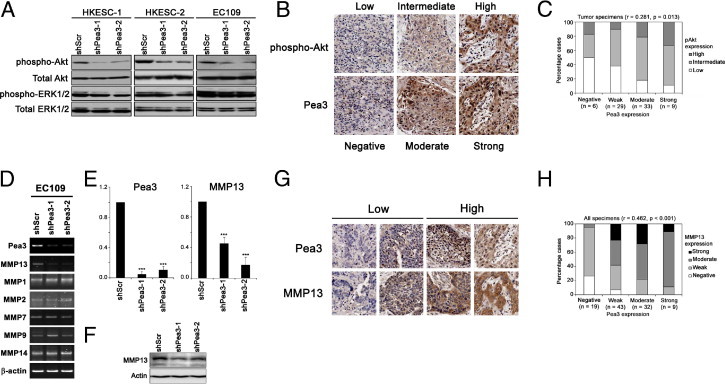
Correlation of Pea3 and pAkt expression. A: A representative Western blot analysis image from three independent experiments showing pAkt, total Akt, phospho-ERK, and total ERK expression. The expression levels of total Akt and total ERK were used as a control. B: Representative IHC staining images showing pAkt and Pea3 staining of three tissue cores. C: A bar chart showing the percentage of specimens that demonstrated different expression levels of pAkt and Pea3 by IHC staining. The result of the Spearman's rank correlation test for all of the tumor specimens is presented. D: RT-PCR of different MMPs that were regulated by Pea3 in other cellular contexts. E: Quantitative real-time PCR showing that EC109 shScr cells express significantly higher levels of mRNA of Pea3 (left) and MMP13 (right) compared with EC109 shPea3-1 and shPea3-2 cells. F: The protein expression of MMP13 was reduced on Pea3 knockdown in EC109 cells. A representative image from three independent experiments is shown. G: Representative IHC staining images for specimens stained with low or high levels of Pea3 and MMP13. The same core is shown in the same column. H: A bar chart showing the percentage of specimens that demonstrated different expression levels of MMP13 and Pea3 by IHC staining. The result of Spearman's rank correlation test for all of the specimens is presented. ***P < 0.001 compared with the shScr control.