
Figure 1.
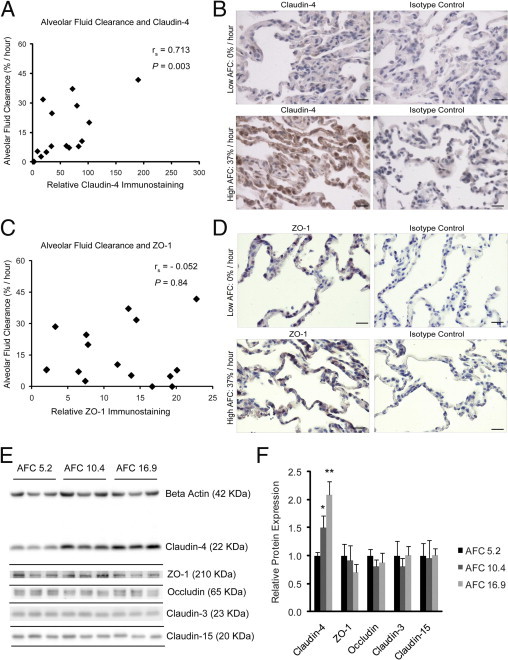
Claudin-4 levels and alveolar fluid clearance (AFC). A: Claudin-4 levels on immunostained distal lung sections were directly correlated with AFC Spearman rank correlation ([rs] = 0.713; P = 0.003; n = 16). B: Representative images demonstrate low claudin-4 staining correlated with low AFC (top left) and high claudin-4 staining correlated with high AFC (bottom left). Isotype controls shown for comparison. C: There was no correlation between ZO-1 staining and AFC (rs = −0.052; P = 0.84; n = 16). D: Representative images demonstrate similar ZO-1 staining in low (top) and high (bottom) AFC samples. Scale bars = 20 μm. E and F: Protein extracts from three additional lungs were resolved by SDS-PAGE in triplicate and levels of claudin-4, ZO-1, occludin, claudin-3, and claudin-15 were determined by immunoblot. The immunoblots were also labeled for β-actin to normalize for total sample protein content. Relative values for each protein were normalized to the lowest AFC sample (AFC = 5.2%/hour). Densitometry revealed that only claudin-4 levels significantly differed among the samples, demonstrating an increase as AFC rates increased (analysis of variance P = 0.001, *P < 0.05 compared with AFC 5.2%/hour, **P < 0.05 compared with both AFC 5.2%/hour and 10.4%/hour). There were no differences in the levels of the other tight junction proteins among the samples. Data are expressed as means ± SD.