
Figure 2.
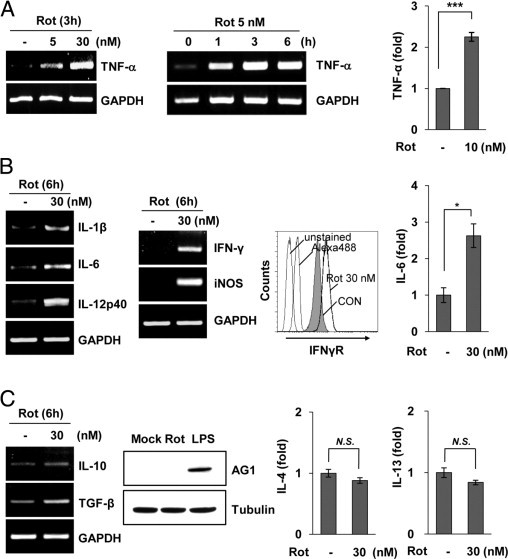
Rotenone (Rot) exposure primes microglia to enter a classically activated state. A: Primary microglia were stimulated with the indicated concentrations of Rot, after which the expression of TNF-α was determined by RT-PCR analysis (left). TNF-α protein was also measured by ELISA in rat primary microglia treated with 10 nmol/L Rot for 24 hours (right). ***P < 0.001 compared with mock-treated controls (CONs). B: The mRNA levels of IL-1β, IL-6, IL-12p40, IFN-γ, and iNOS were determined by RT-PCR (left). The level of IFNγR was observed by flow cytometric analysis using an anti-IFNγR antibody (middle). The level of IL-6 secreted into the media was measured by ELISA in primary microglia treated with 30 nmol/L Rot for 24 hours (right). *P < 0.05 compared with mock-treated CONs. C: The mRNA levels of IL-10 and transforming growth factor-β were determined by RT-PCR (left). Primary microglia were cultured with 30 nmol/L Rot or 10 ng/mL lipopolysaccharide for 24 hours, and the levels of arginase (AG)-1 were measured using Western blot analysis (middle). The levels of IL-4 or IL-13 were assayed by ELISA (right). GAPDH indicates glyceraldehyde-3-phosphate dehydrogenase; N.S., no significant difference.