
Figure 8.
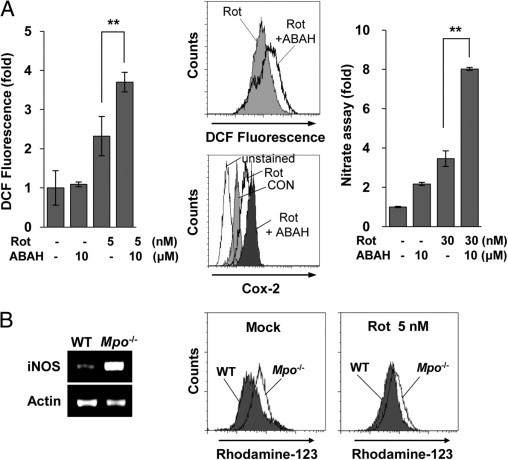
Blockade of MPO activity unexpectedly enhances rotenone (Rot)-induced ROS generation and cell death. A: BV2 microglia were pretreated with ABAH (10 μmol/L) for 30 minutes and then mock treated or treated with 5 nmol/L Rot for 1 hour. Left: The cells were harvested and stained with 5 μmol/L DCF for 30 minutes at 37°C to measure ROS generation. The graph represents the fold changes in mean ± SEM fluorescence intensity from three independent experiments. **P < 0.005 compared with mock-treated cells. Middle: Primary microglia were pretreated with ABAH (10 μmol/L) for 30 minutes and then treated with 30 nmol/L Rot for 3 or 24 hours, after which ROS levels (top) and intracellular COX-2 levels (bottom) were measured by FACS analysis using DCF and COX-2 antibody, respectively. The data shown are representative of at least three independent experiments. Right: Primary microglia were mock treated or treated with 30 nmol/L Rot in the presence or absence of 10 μmol/L ABAH for 2 days, and supernatants were assayed for nitrate concentration, as described in Materials and Methods. **P < 0.005 compared with Rot-treated cells. B: Primary glial cells were cultured from Mpo−/− mice (Mpo−/−) or B6 WT mice (WT), and the cells were incubated with or without 5 nmol/L Rot for 6 hours. The transcript levels of iNOS were determined by RT-PCR (left), and ROS generation was measured by FACS using rhodamine-123 (right).