
Figure 1.
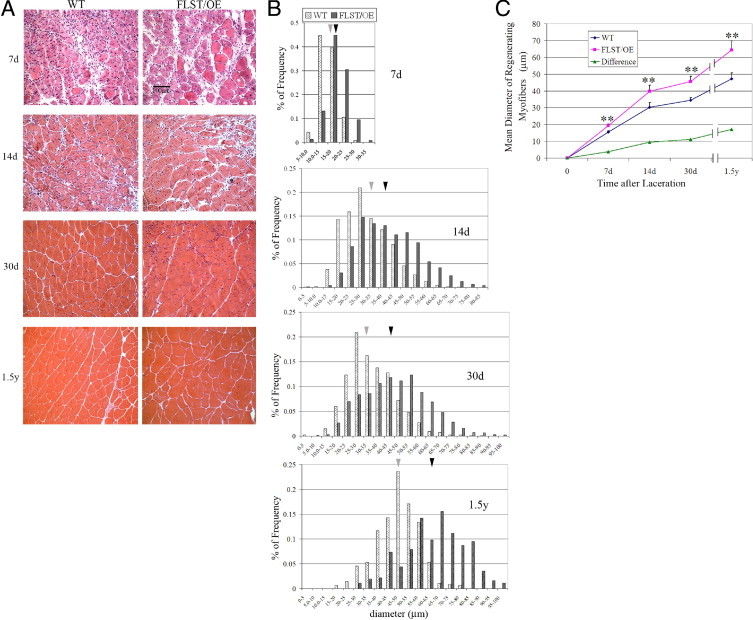
Injured follistatin-overexpressing (FLST/OE) skeletal muscles showed accelerated regeneration compared with their WT counterparts. A: H&E staining of cross-sections of injured WT and FLST/OE skeletal muscle at 7, 14, and 30 days and 1.5 years after laceration injury. The myofibers and nuclei stained red and black, respectively. Original magnification, ×200. Regenerating myofibers are characterized by centralized nuclei. Black scale bar represents 100 μm. B: Distribution of diameters of regenerating myofibers in WT and FLST/OE skeletal muscle 7 (n = 3), 14 (n = 8), and 30 (n = 8) days and 1.5 years (n = 4) after injury. Gray bars represent myofibers from WT mice, whereas black bars represent myofibers from FLST/OE mice. Moreover, the gray arrowheads indicate mean diameters of regenerating fibers in WT muscle, whereas black arrowheads indicate mean diameters of regenerating fibers in FLST/OE muscle. C: Regenerating myofiber diameter quantifications. The smallest diameters of more than 300 nonadjacent myofibers per muscle were measured using Northern Eclipse software. The mean diameters of regenerating fibers were shown to increase in both WT and FLST/OE muscles over time after injury; however, the mean diameters of the FLST/OE fibers were significantly greater at all time points (*P < 0.05, **P < 0.01).