
Figure 3.
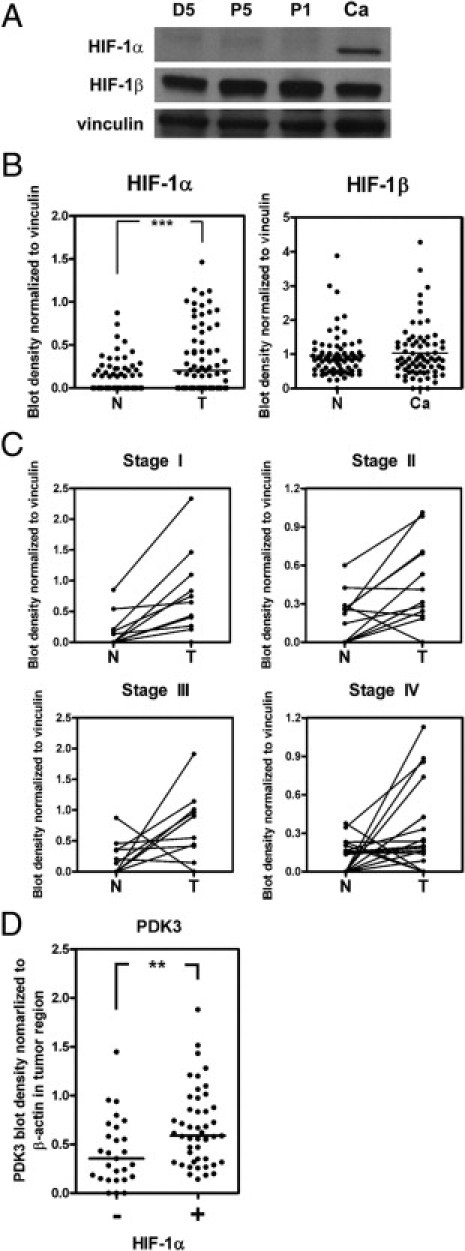
Elevation of PDK3 is positively correlated with increased HIF-1α level in colon cancer. A: Representative Western blot shows the levels of HIF-1α, HIF-1β, and vinculin in four different tissues collected from the same individual. D5: 5 cm distal of cancer region; P5 and P1: 5 cm and 1 cm proximal of cancer, respectively; Ca, cancer. B:Levels of HIF-1α and HIF-1β in 74 paired normal (N) and colon cancer (Ca) tissues detected by Western blot analysis. The bar indicates the medium of blot density. ***P < 0.001. C: The levels of HIF-1α in paired normal (N) and cancer (Ca) regions in each stage of cancer. Stage I, n = 15; stage II, n = 18; stage III, n = 20; stage IV, n = 21. P values were calculated by paired t-test. Stage I: P = 0.01; stage II: P = 0.013; stage III: P = 0.037; stage IV: P = 0.029. D: The ratios (cancer to normal) of PDK3 determined by Western blot analysis were shown according to the presence or absence of HIF-1α. Forty-seven HIF-1α–positive (+) and 27 HIF-1α–negative (−) samples were analyzed. **P < 0.01, calculated by paired t-test.